This article is intended for decision-makers in the insurance industry, auto insurance product managers, prevention program managers, and actuaries who want to discover the level of granularity that smartphone telematics delivers.
Introduction
Back in 1990, Denis Kessler explained in his "Très Petit Dictionnaire d'Économie de l'Assurance" that "the search for information comes with a price tag. Notably, the insurer lacks insight into the agent's prudence, a factor that undoubtedly should impact the premium offered to the insured."
In 2023, technological developments are challenging this asymmetry within several insurance sectors. Car insurance, in particular, is impacted by the democratization of new driving analysis tools, such as smartphone telematics.
Traditionally, car insurers calculate premiums on the basis of an insured's claims history and declarative criteria (age, place of residence, parking, etc.). However, smartphone telematics now provide insurers with a powerful means of gathering data that accurately reflects driving behavior and assesses road risk: harsh acceleration, hard braking and distracted driving.
But how can these metrics be effectively leveraged? How can they be employed to categorize and segment a community of drivers? And, most importantly, how can insurers identify drivers at greater risk in order to target prevention initiatives more effectively? This article aims to provide answers, with a specific focus on the distraction caused by phone usage while driving.
To begin, we explain the two types of distraction events measured by DriveQuant's telematics solution, along with the methodology used to compute the distraction score. Following that, we will outline how a community of drivers can be categorized based on their distraction behaviors. Finally, we will delve into the distraction profiles of four individual drivers, extracting insights to personalize preventive guidance.
Definition of indicators and distraction score
Our distraction analysis service distinguishes two types of distraction events related to phone usage while driving:
- Screen unlocks, which indicate reading a message or using an application.
-
Forbidden phone calls, which are not made using the vehicle's hands-free system.
The distraction score is influenced by both the frequency and duration of these events. The calculation method is illustrated as follows:
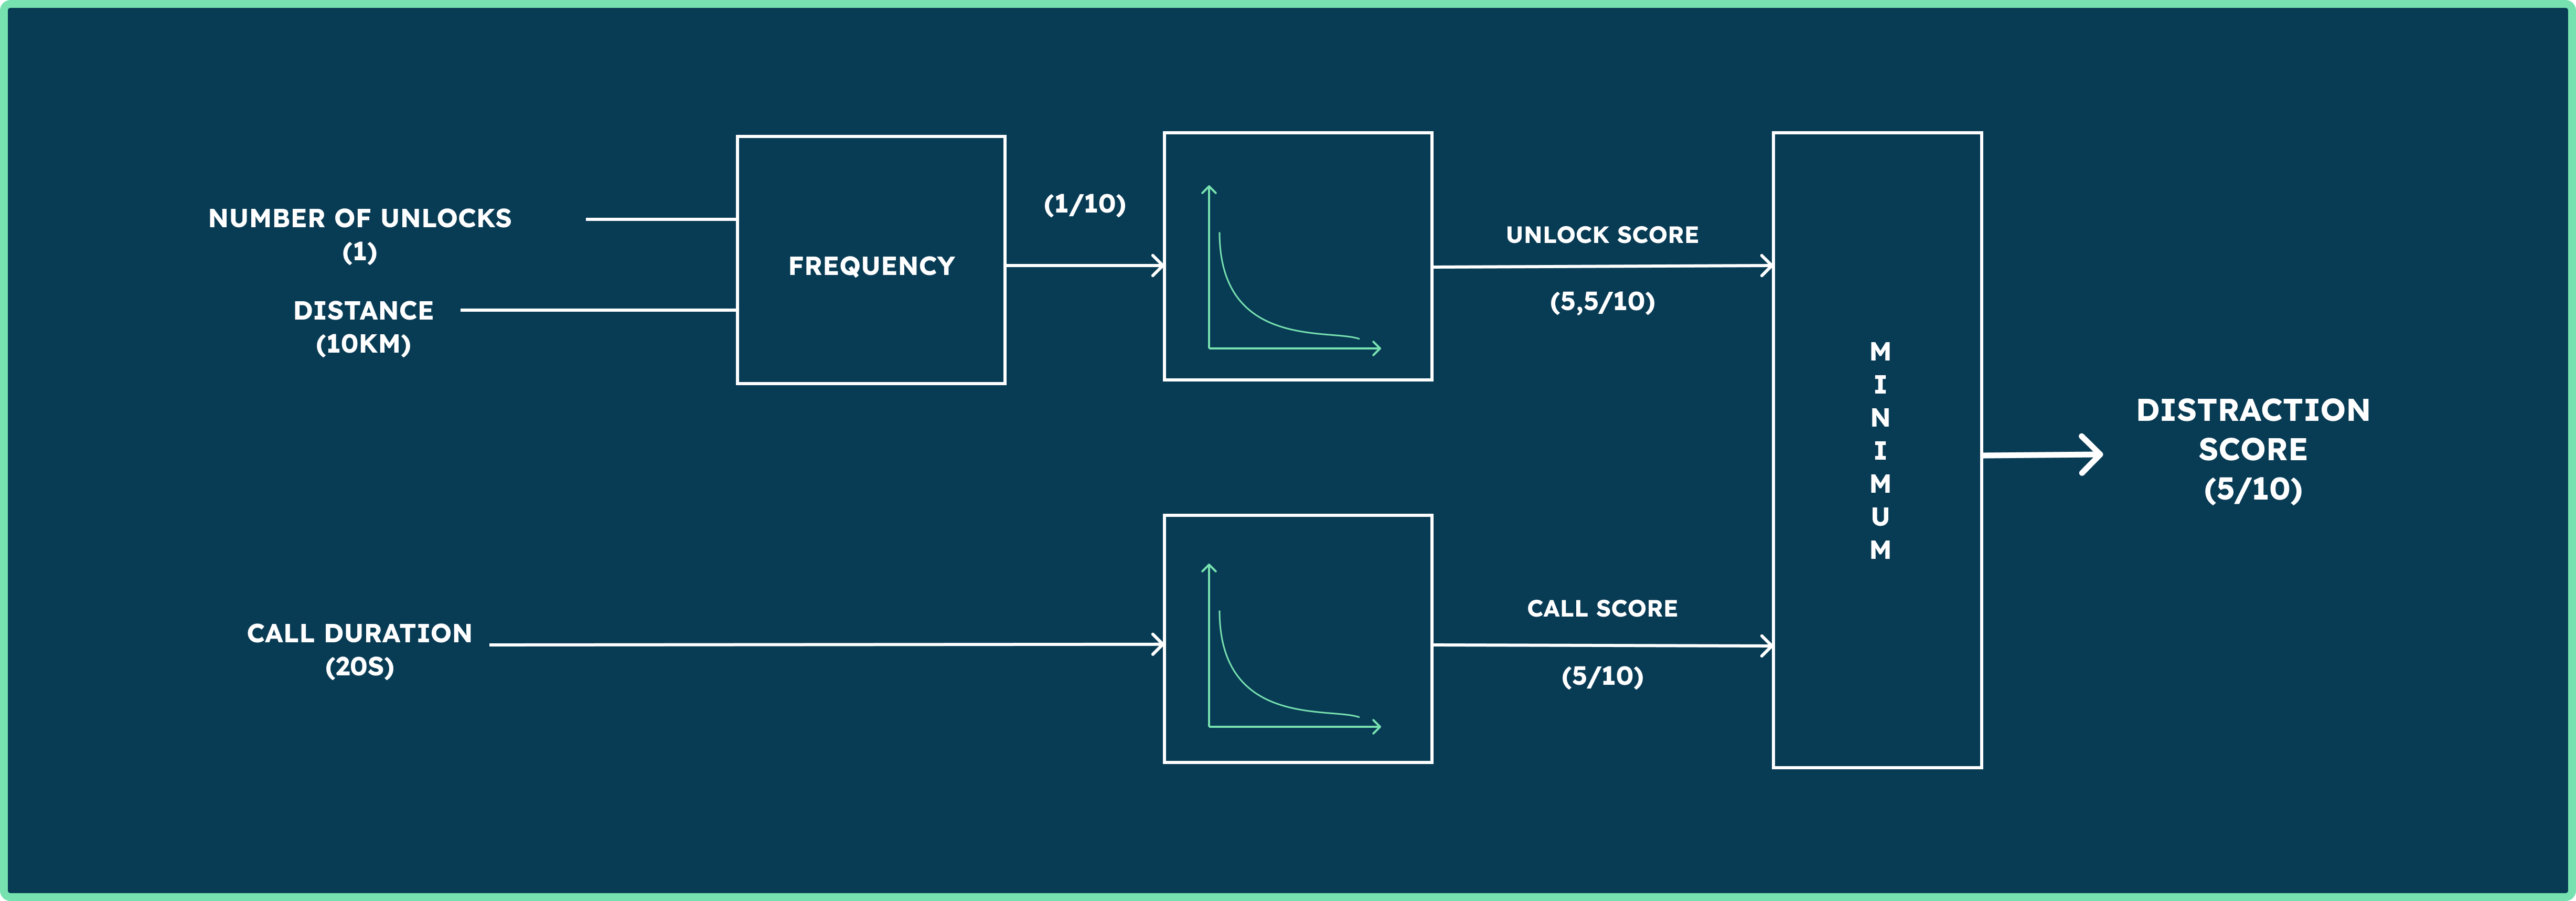
For each trip made, the service returns :
- a sub-score based on the frequency of unlocks per kilometer.
- a sub-score based on the duration of forbidden phone calls.
The lowest sub-score is considered as the distraction score.
Figure 2 shows the sensitivity functions for each sub-score. These are decreasing functions which penalize the driver when the frequency of unlocks or the call duration increases during the trip.
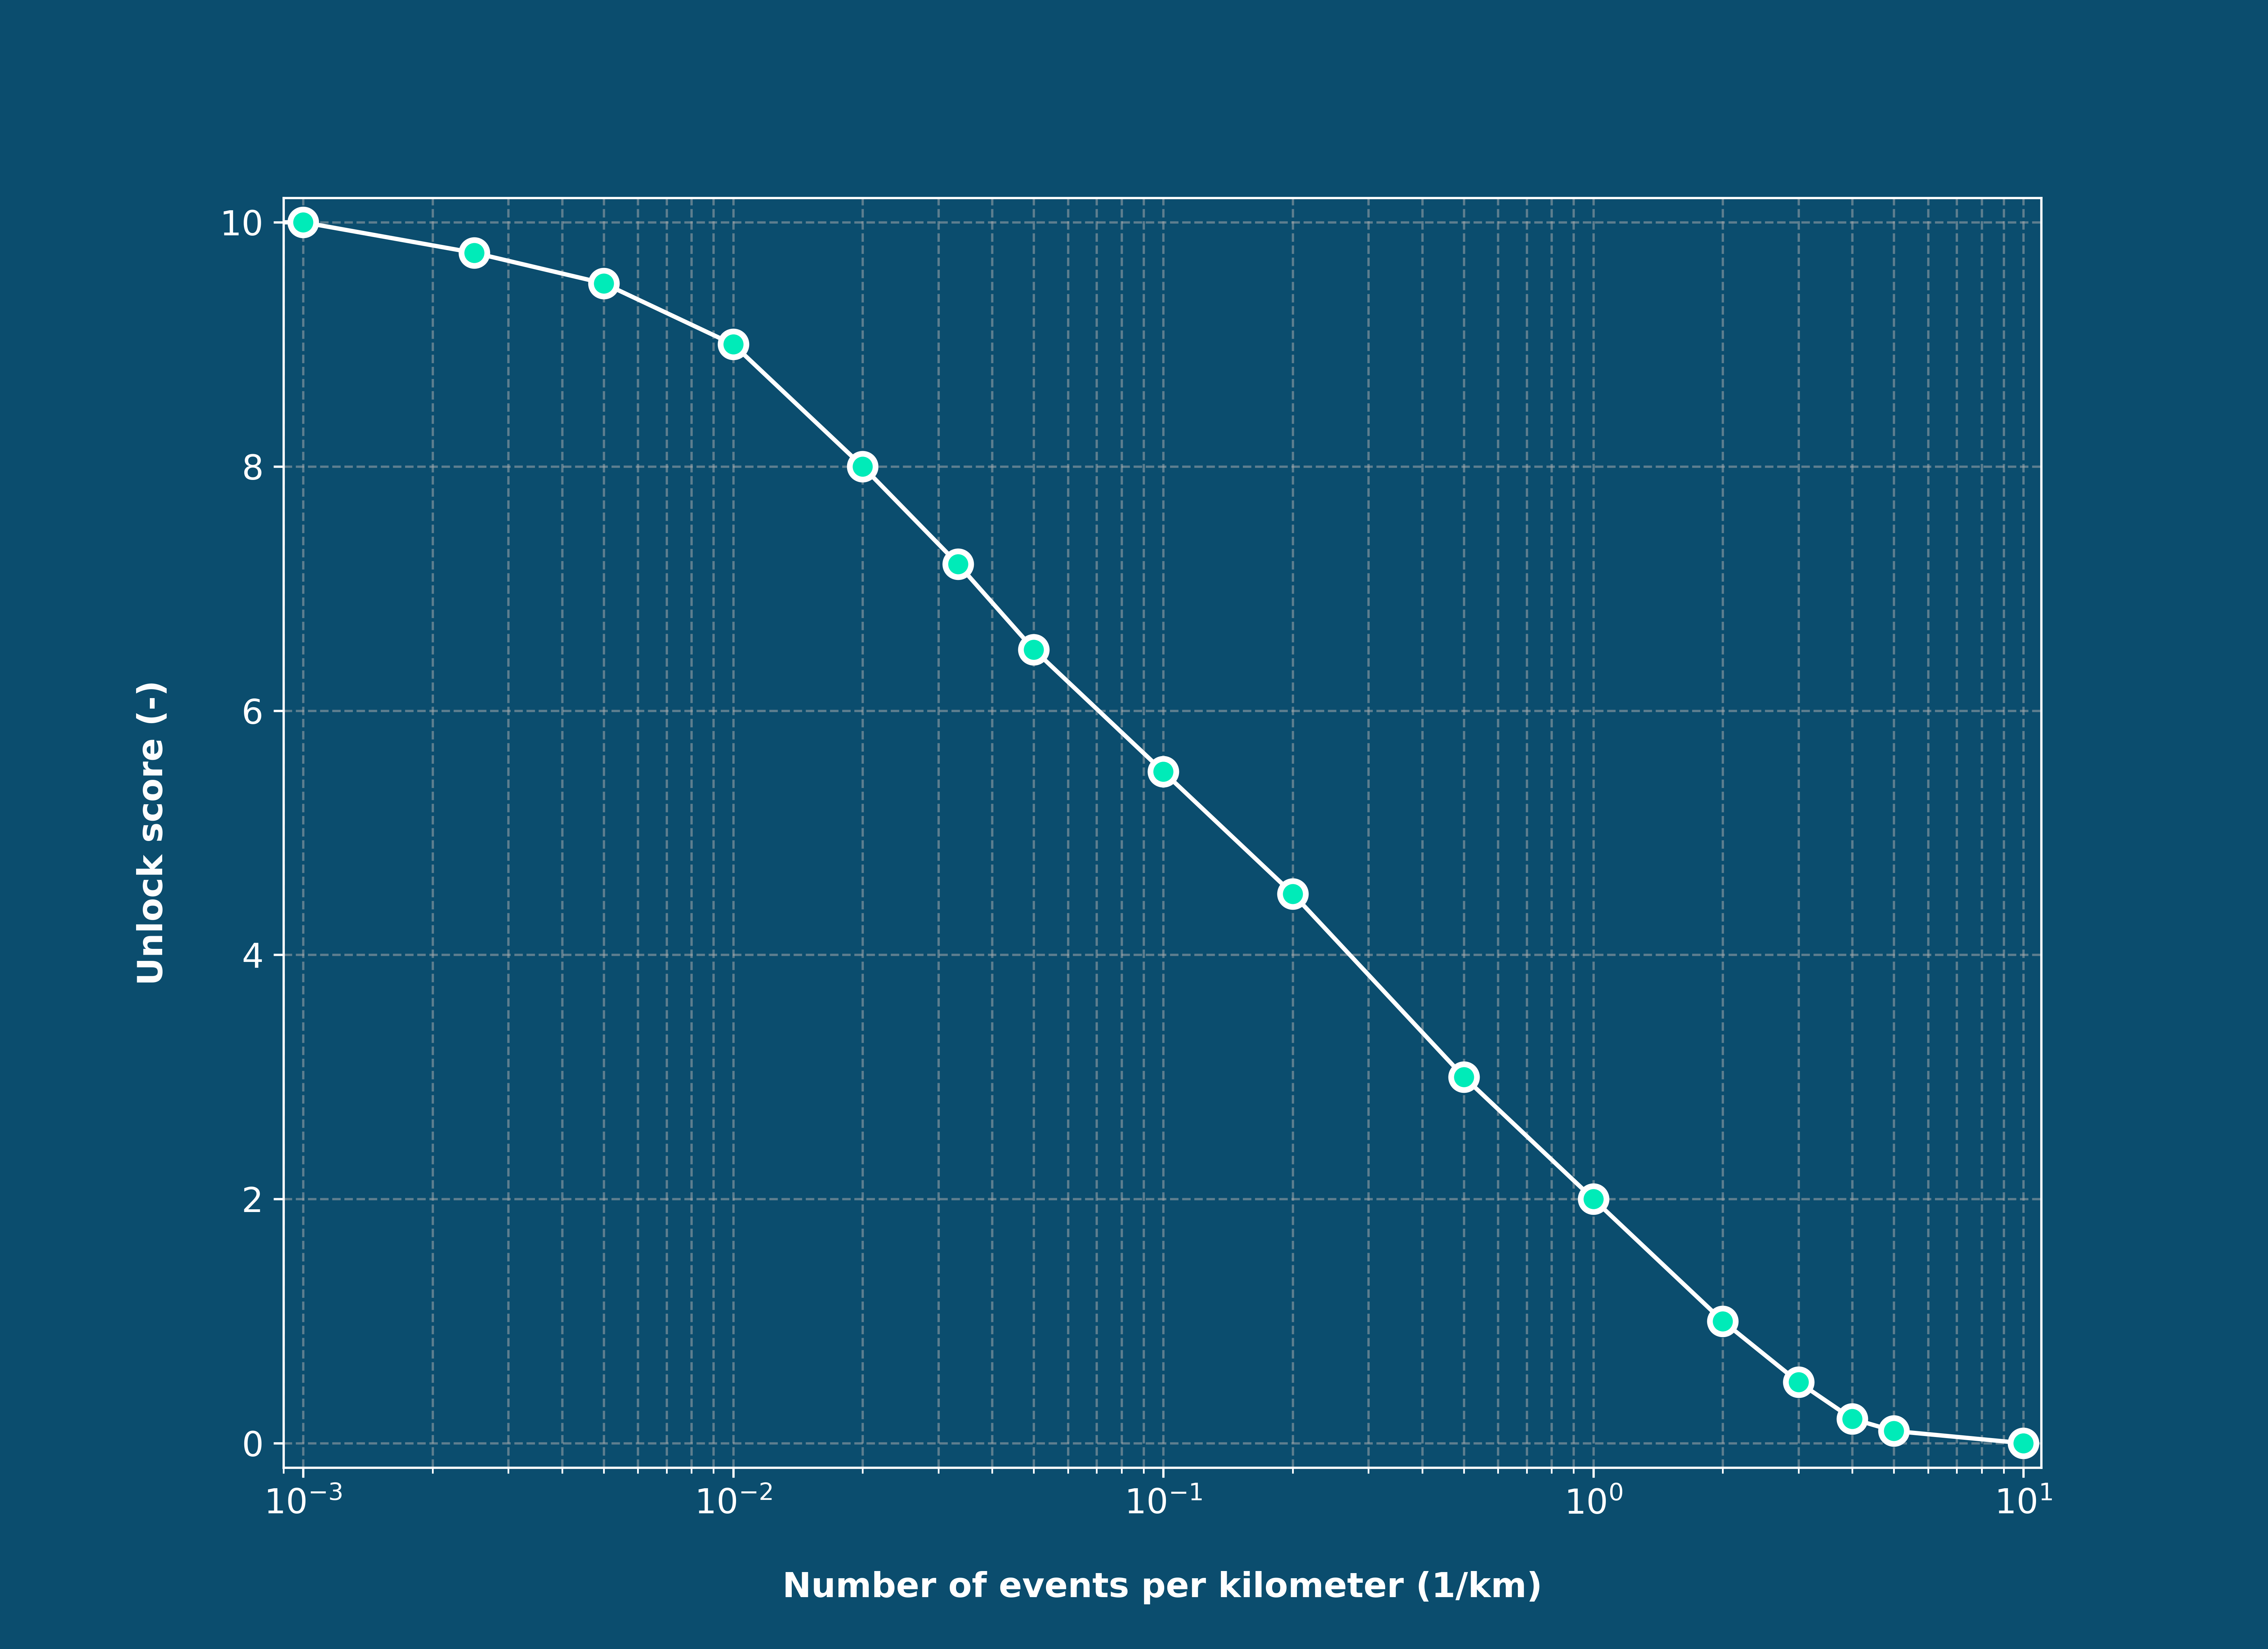
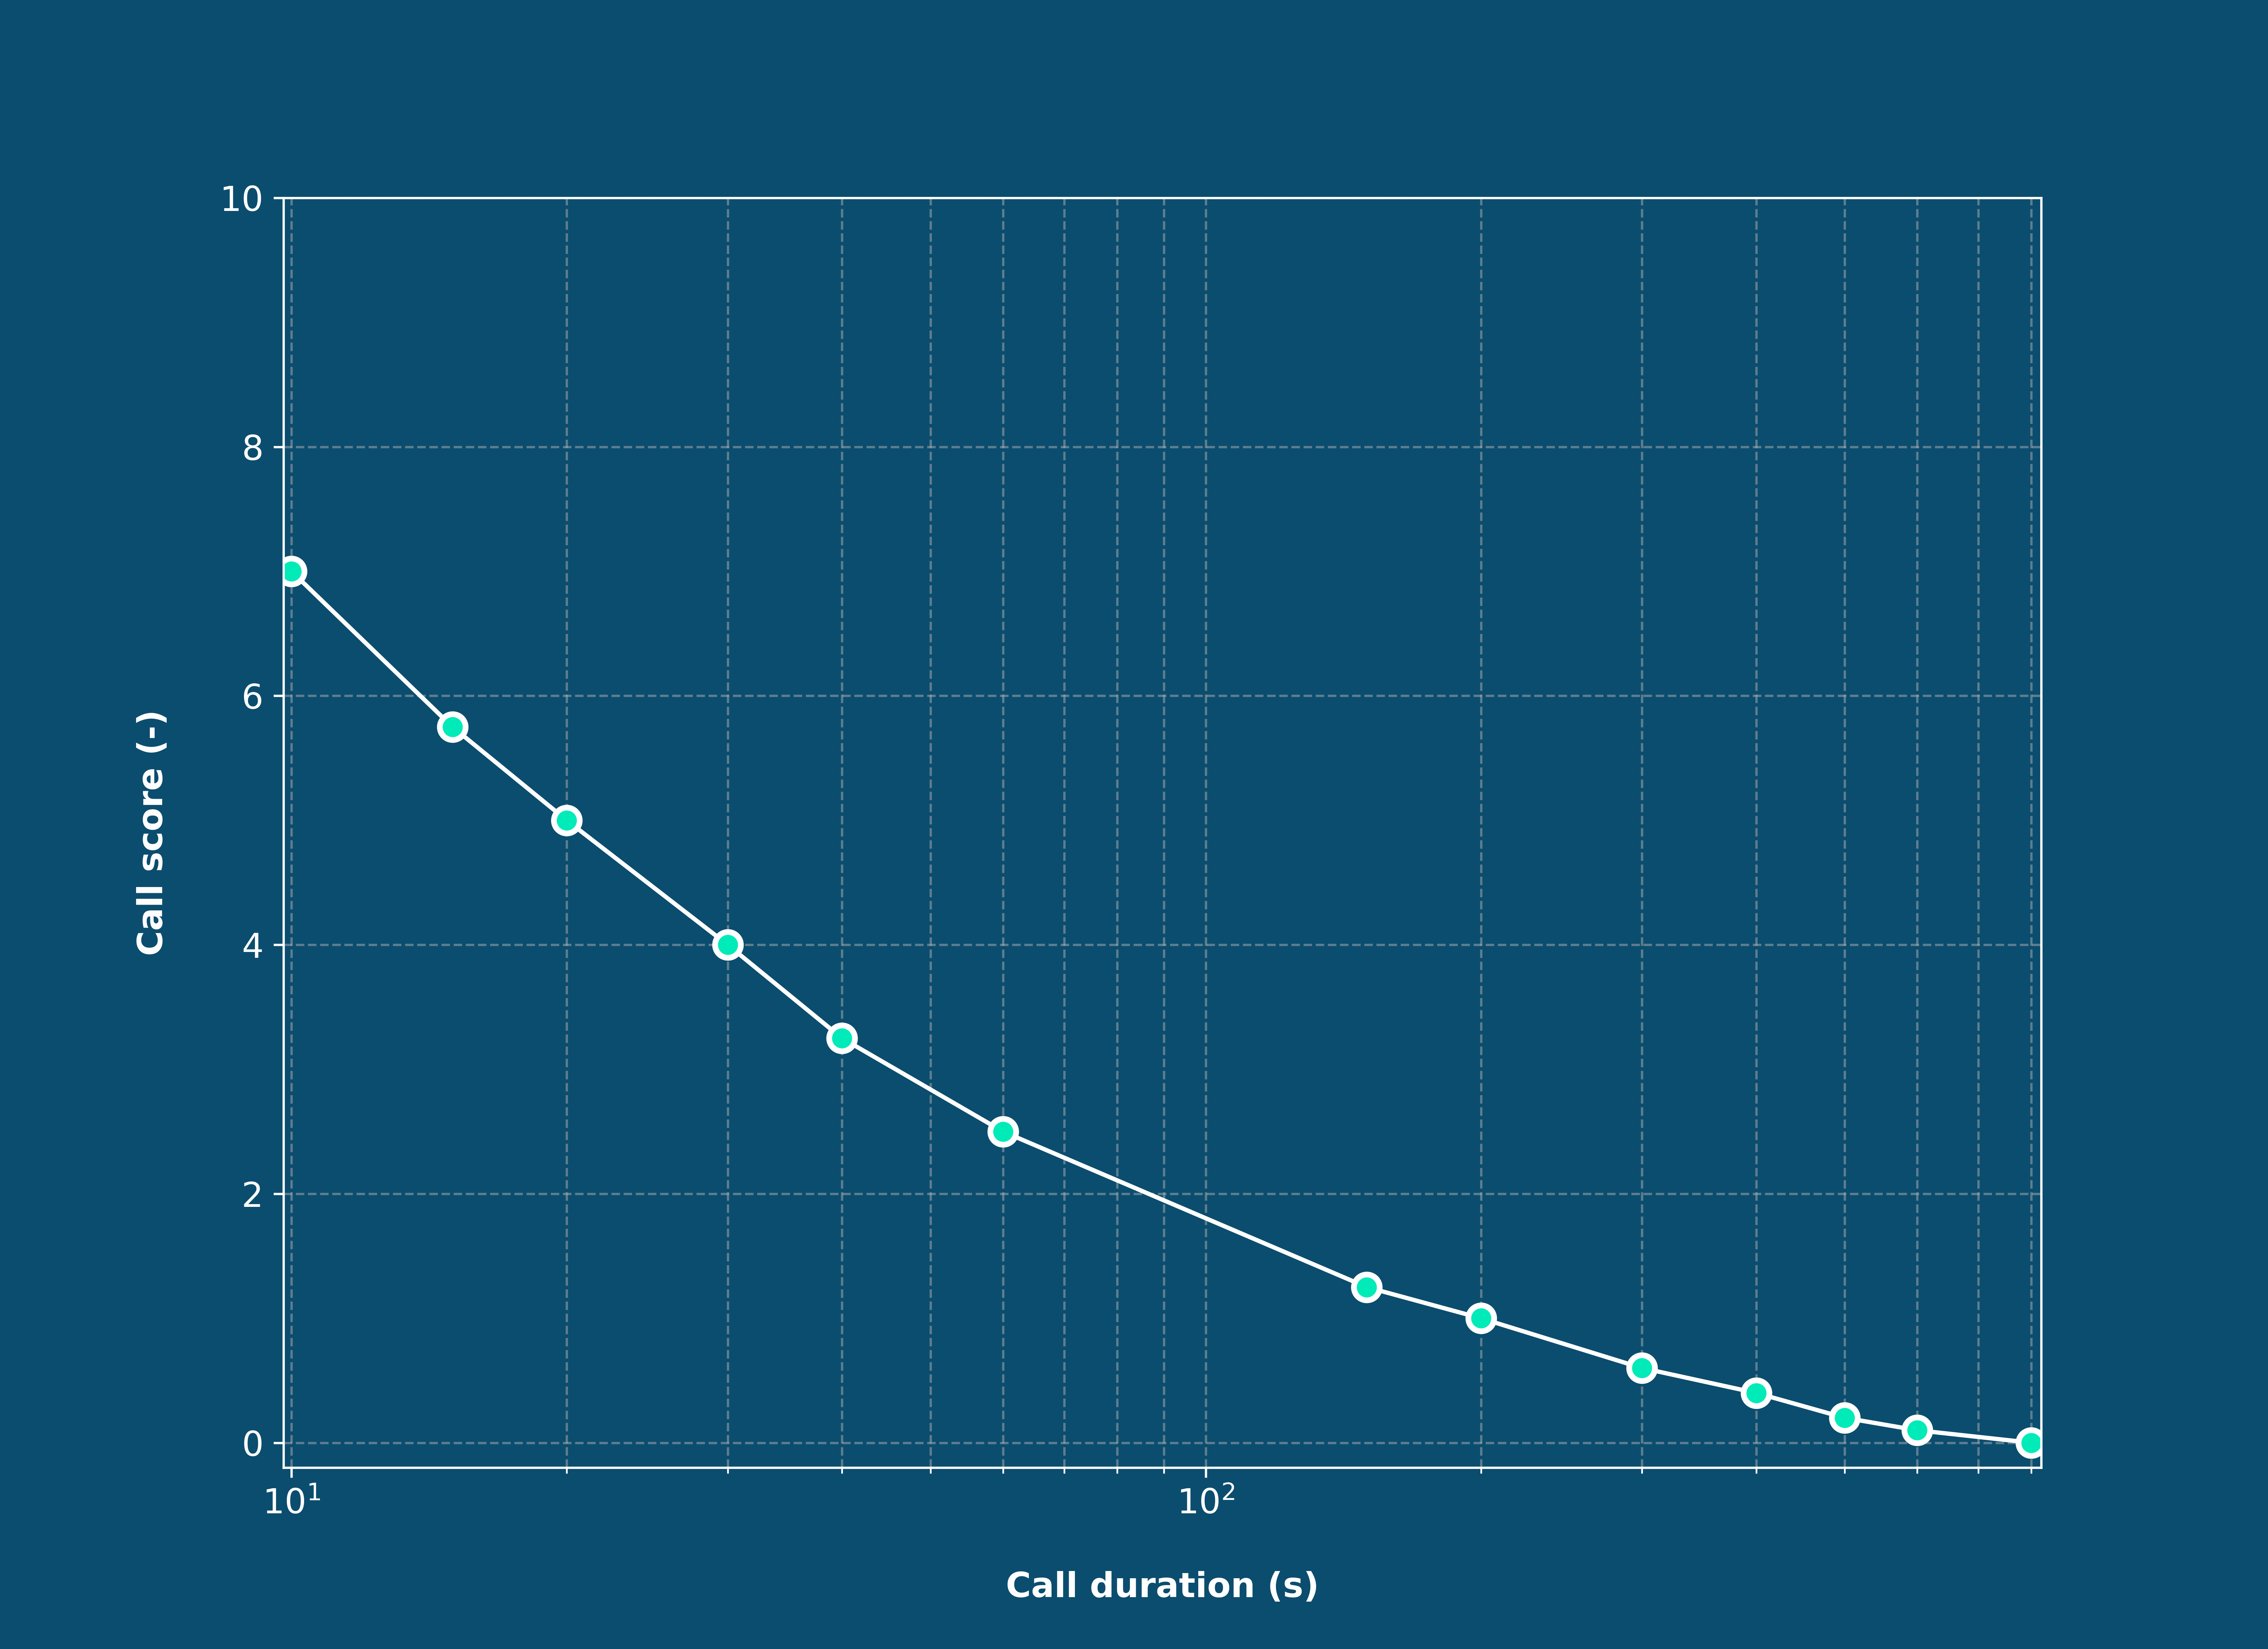
Figure 2 - Sensitivity functions used to compute the unlock score (left) and the call score (right).
Segmentation of a community of drivers based on their distraction behavior
Our distraction analysis service distinguishes between two types of event: unlocks and forbidden calls. Therefore, it is possible to visualize the distribution between unlocks and phone calls for each driver. This is what Figure 3 shows below for a community of 10,000 drivers who have completed at least 200 trips with our telematics app.
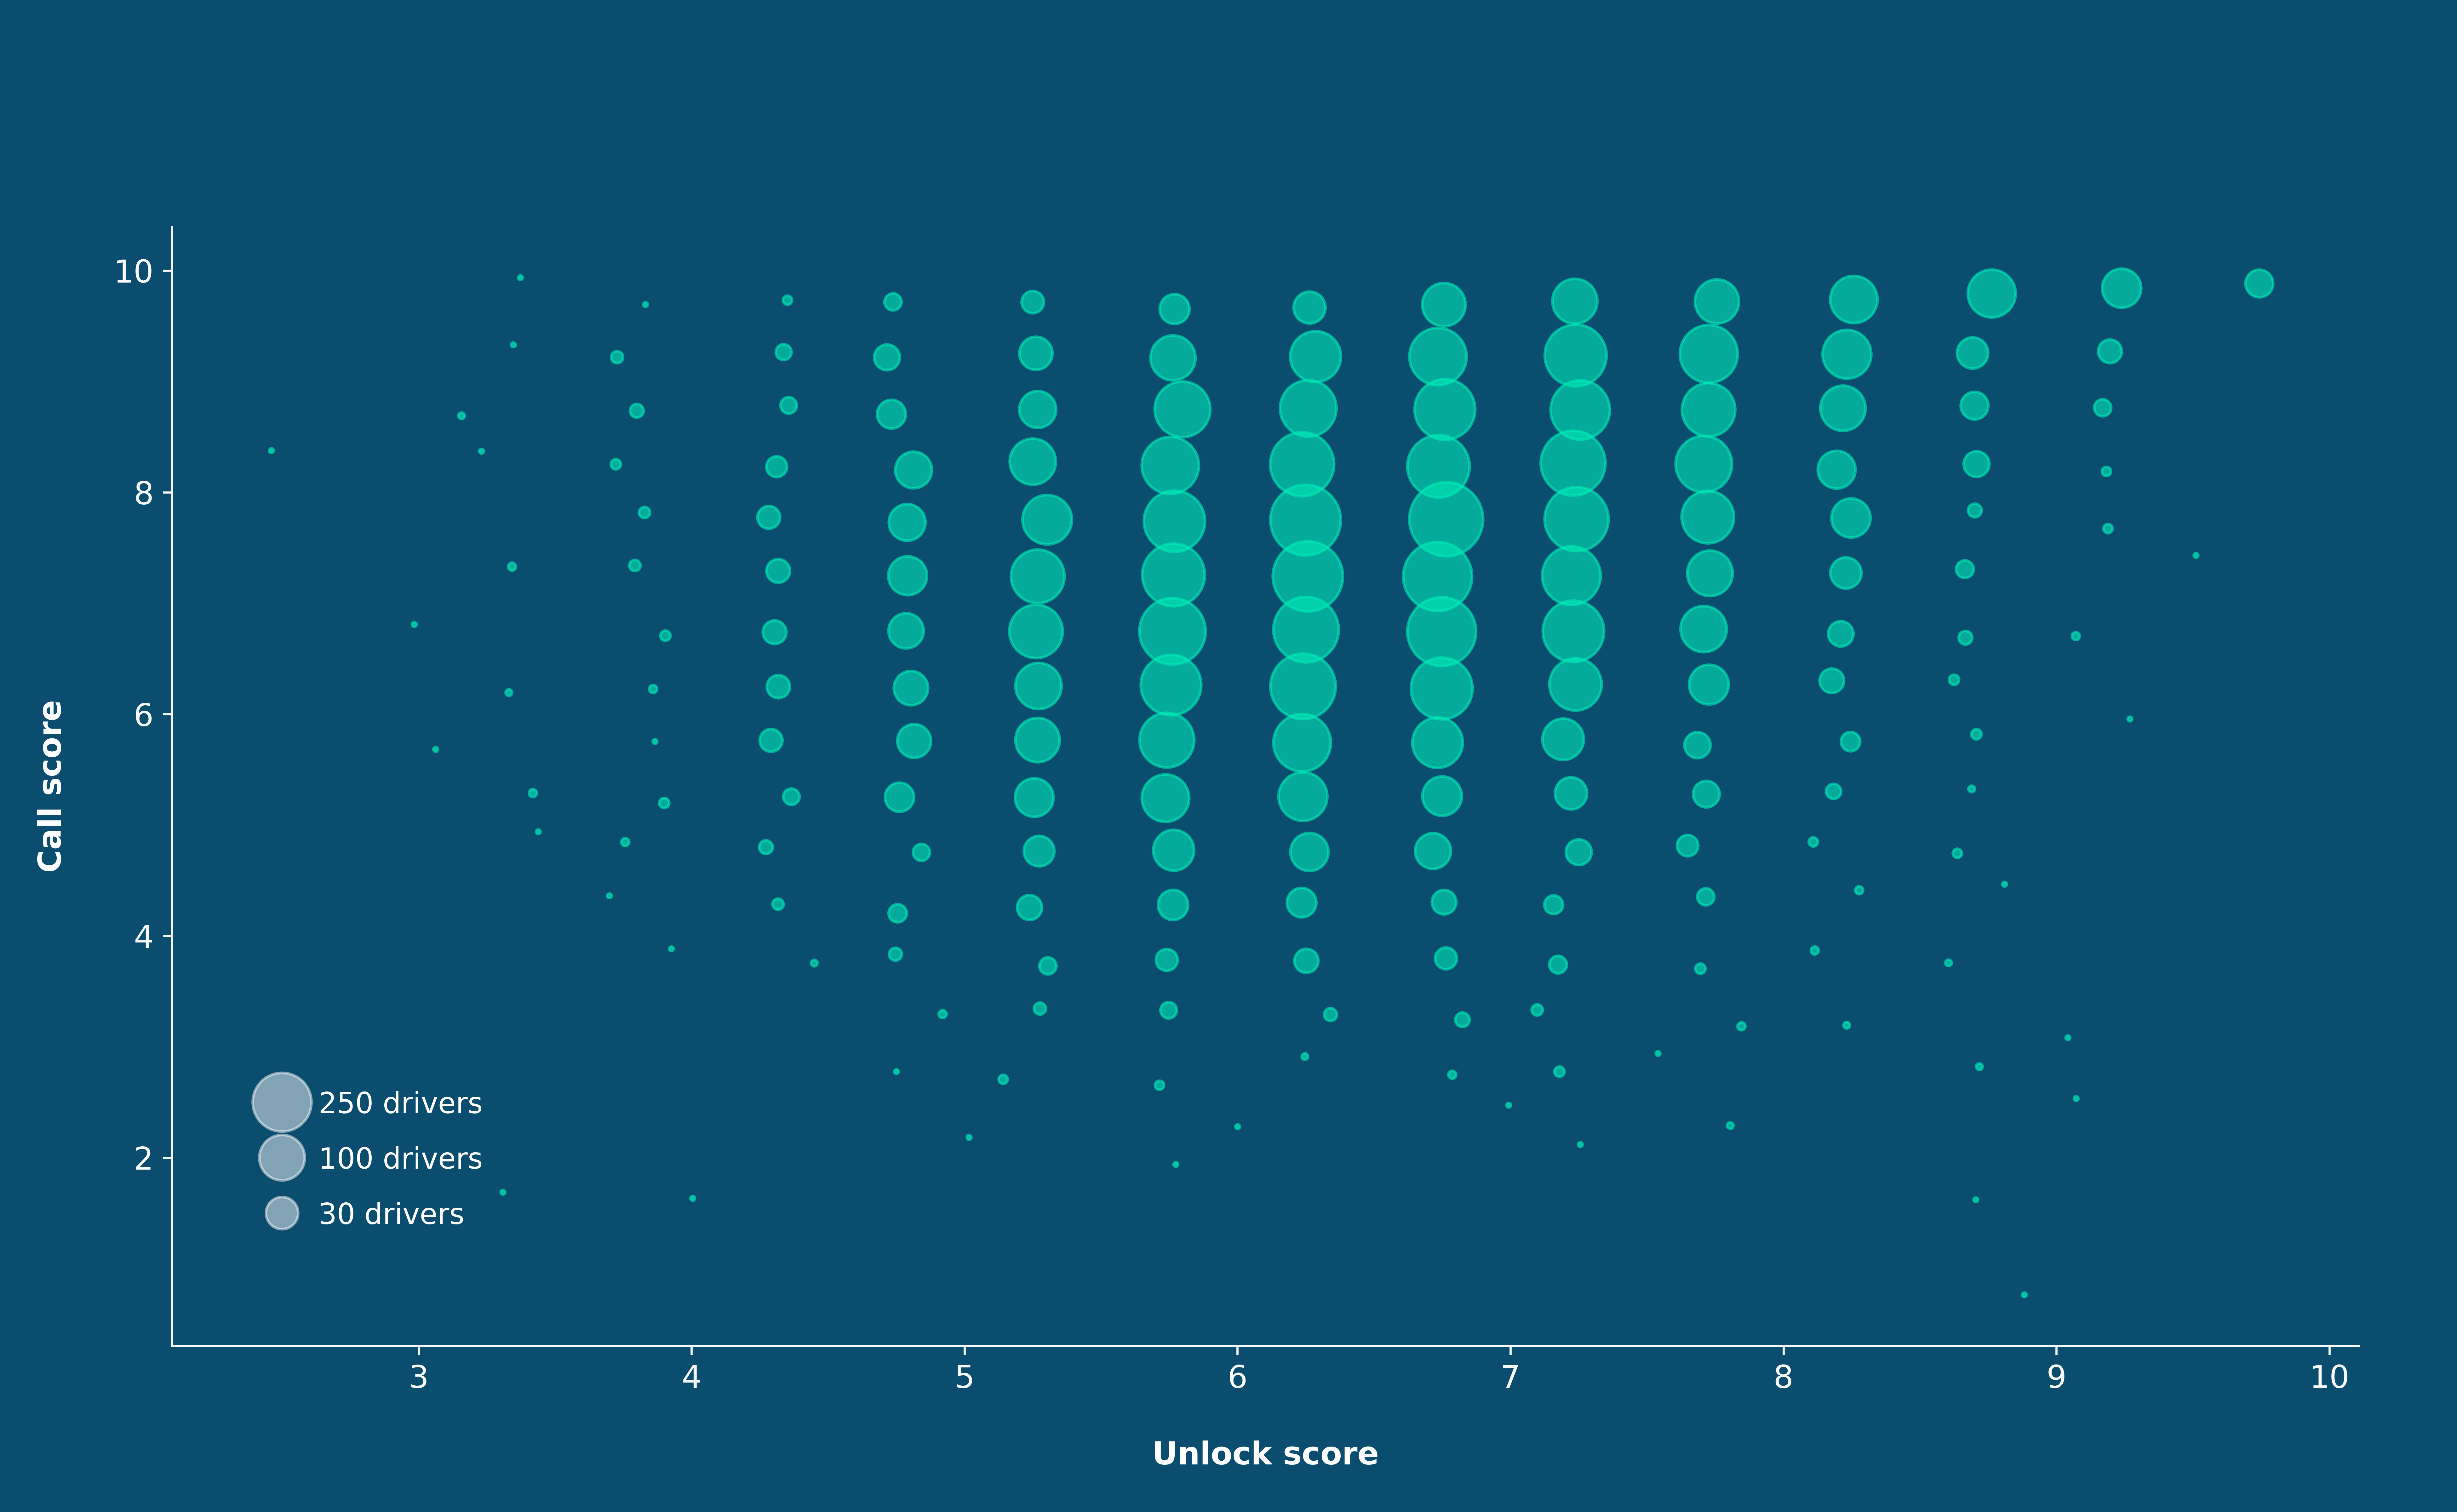
Figure 3 - Performance of drivers represented on the plane of unlock scores and call scores.
The distribution of drivers in this two dimentions plane gives the insurer a comprehensive view of the diversity of distraction behaviors in his portfolio of policyholders. The insurer can then partition his portfolio according to distraction type and intensity (Figure 4).
The two-dimensional plane is divided into 9 quadrants that define groups of drivers. The values chosen to bound the quadrants apply to both scores:
-
Good: the score is greater than 9/10.
-
Average: score between 7/10 and 9/10.
-
Poor: score below 7/10.
These thresholds have been chosen empirically. They can be adjusted by insurers according to the risk levels and claims experience of the drivers concerned.
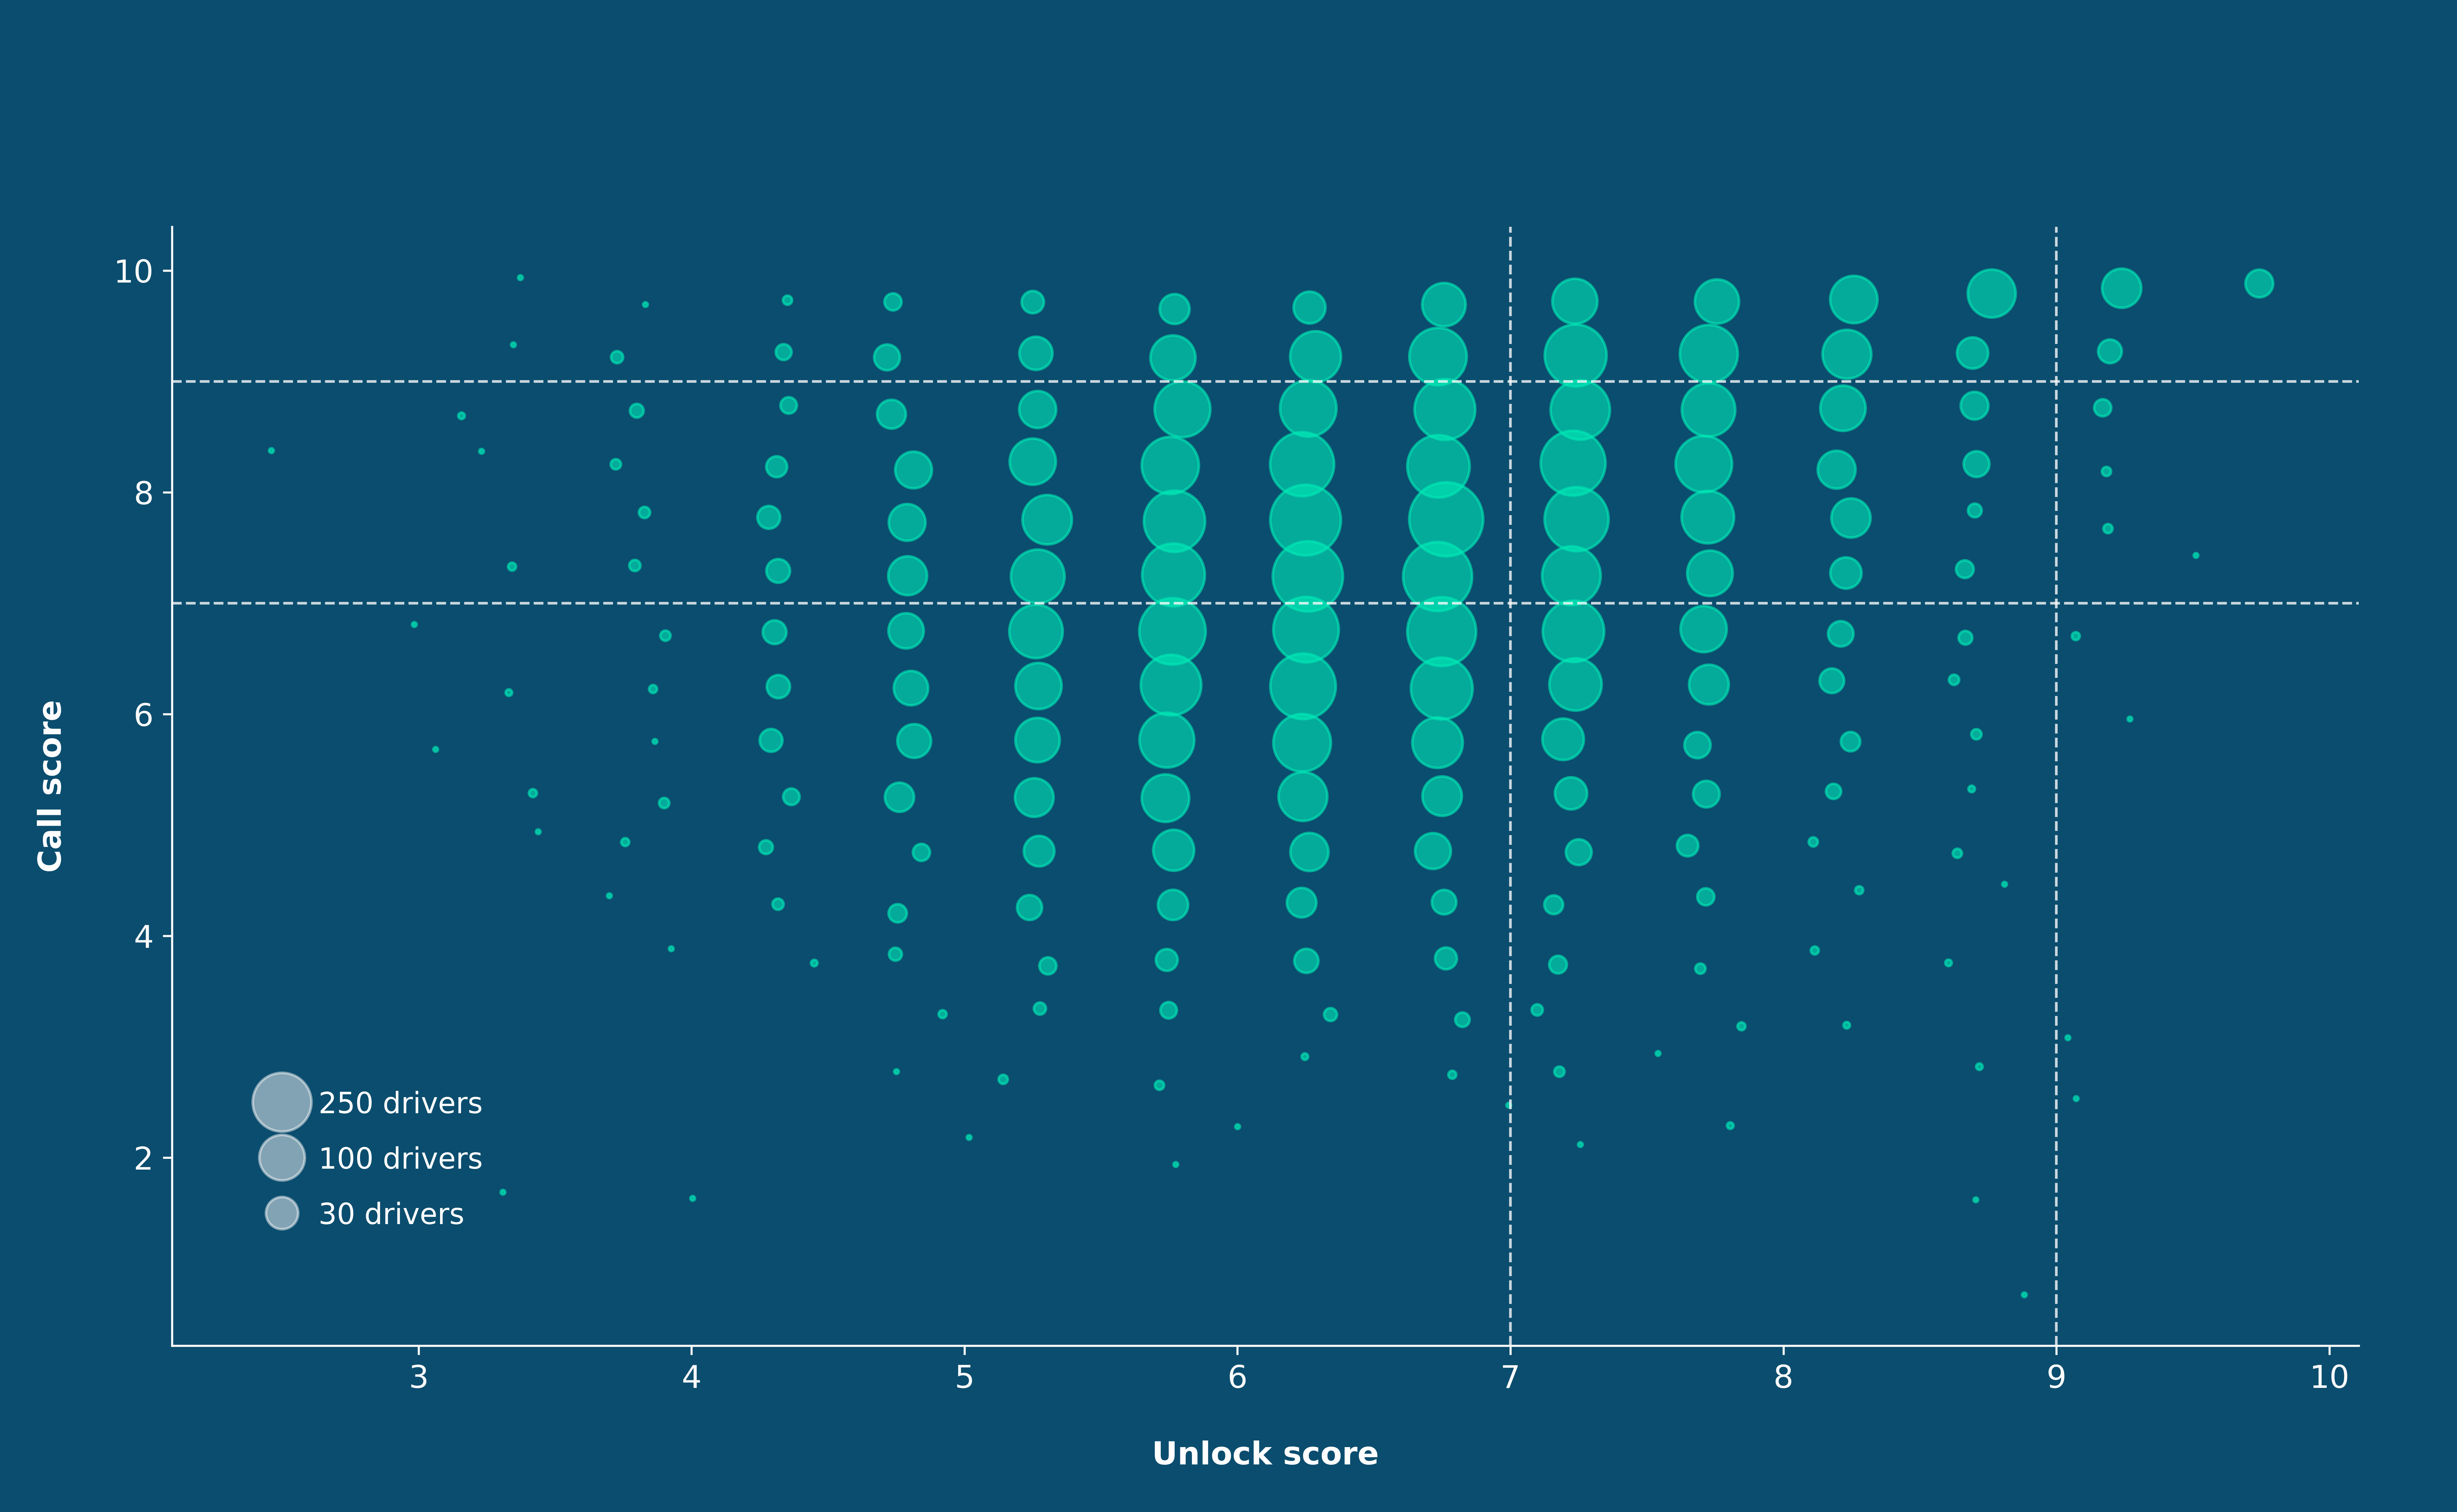
Figure 4 - Quadrant partitioning in the plane defined by the unlock score and the call score.
The following table indicates the number of drivers included in each quadrant:
|
Unlock score |
||||
|
bad |
average |
good |
||
|
Call score |
bad |
3290 |
949 |
6 |
|
average |
3158 |
1644 |
23 |
|
|
good |
714 |
920 |
138 |
|
The average driver's distracted behavior involves phone calls and unlocks.Around 30% of drivers are very distracted. They frequently unlock their phone and regularly make forbidden calls. At the opposite end of the spectrum, less than 2% of drivers never use their phone while driving.
We can also segment a community of drivers using other reference systems based on distraction events:
-
in a reference system defined by the frequency of unlocks and the frequency of calls.
-
in a reference system defined by the unlock frequency and call duration per trip.
Figure 5 shows the average values for the number of unlocks per 100 km and the average values for the percentage of tripswith calls for each driver. We keep a partition of this two-dimensional reference system in 9 quadrants with the following thresholds:
-
Unlock frequency:
-
Good: less than 5 unlockings per 100 km.
-
Average: Between 5 and 15 unlockings per 100 km.
-
Poor: more than 15 unlocks per 100 km.
-
-
Frequency of trips with forbidden calls :
-
Good: Less than 5% of trips Average: Between 5% and 20% of trips
-
Poor: More than 20% of trips
-
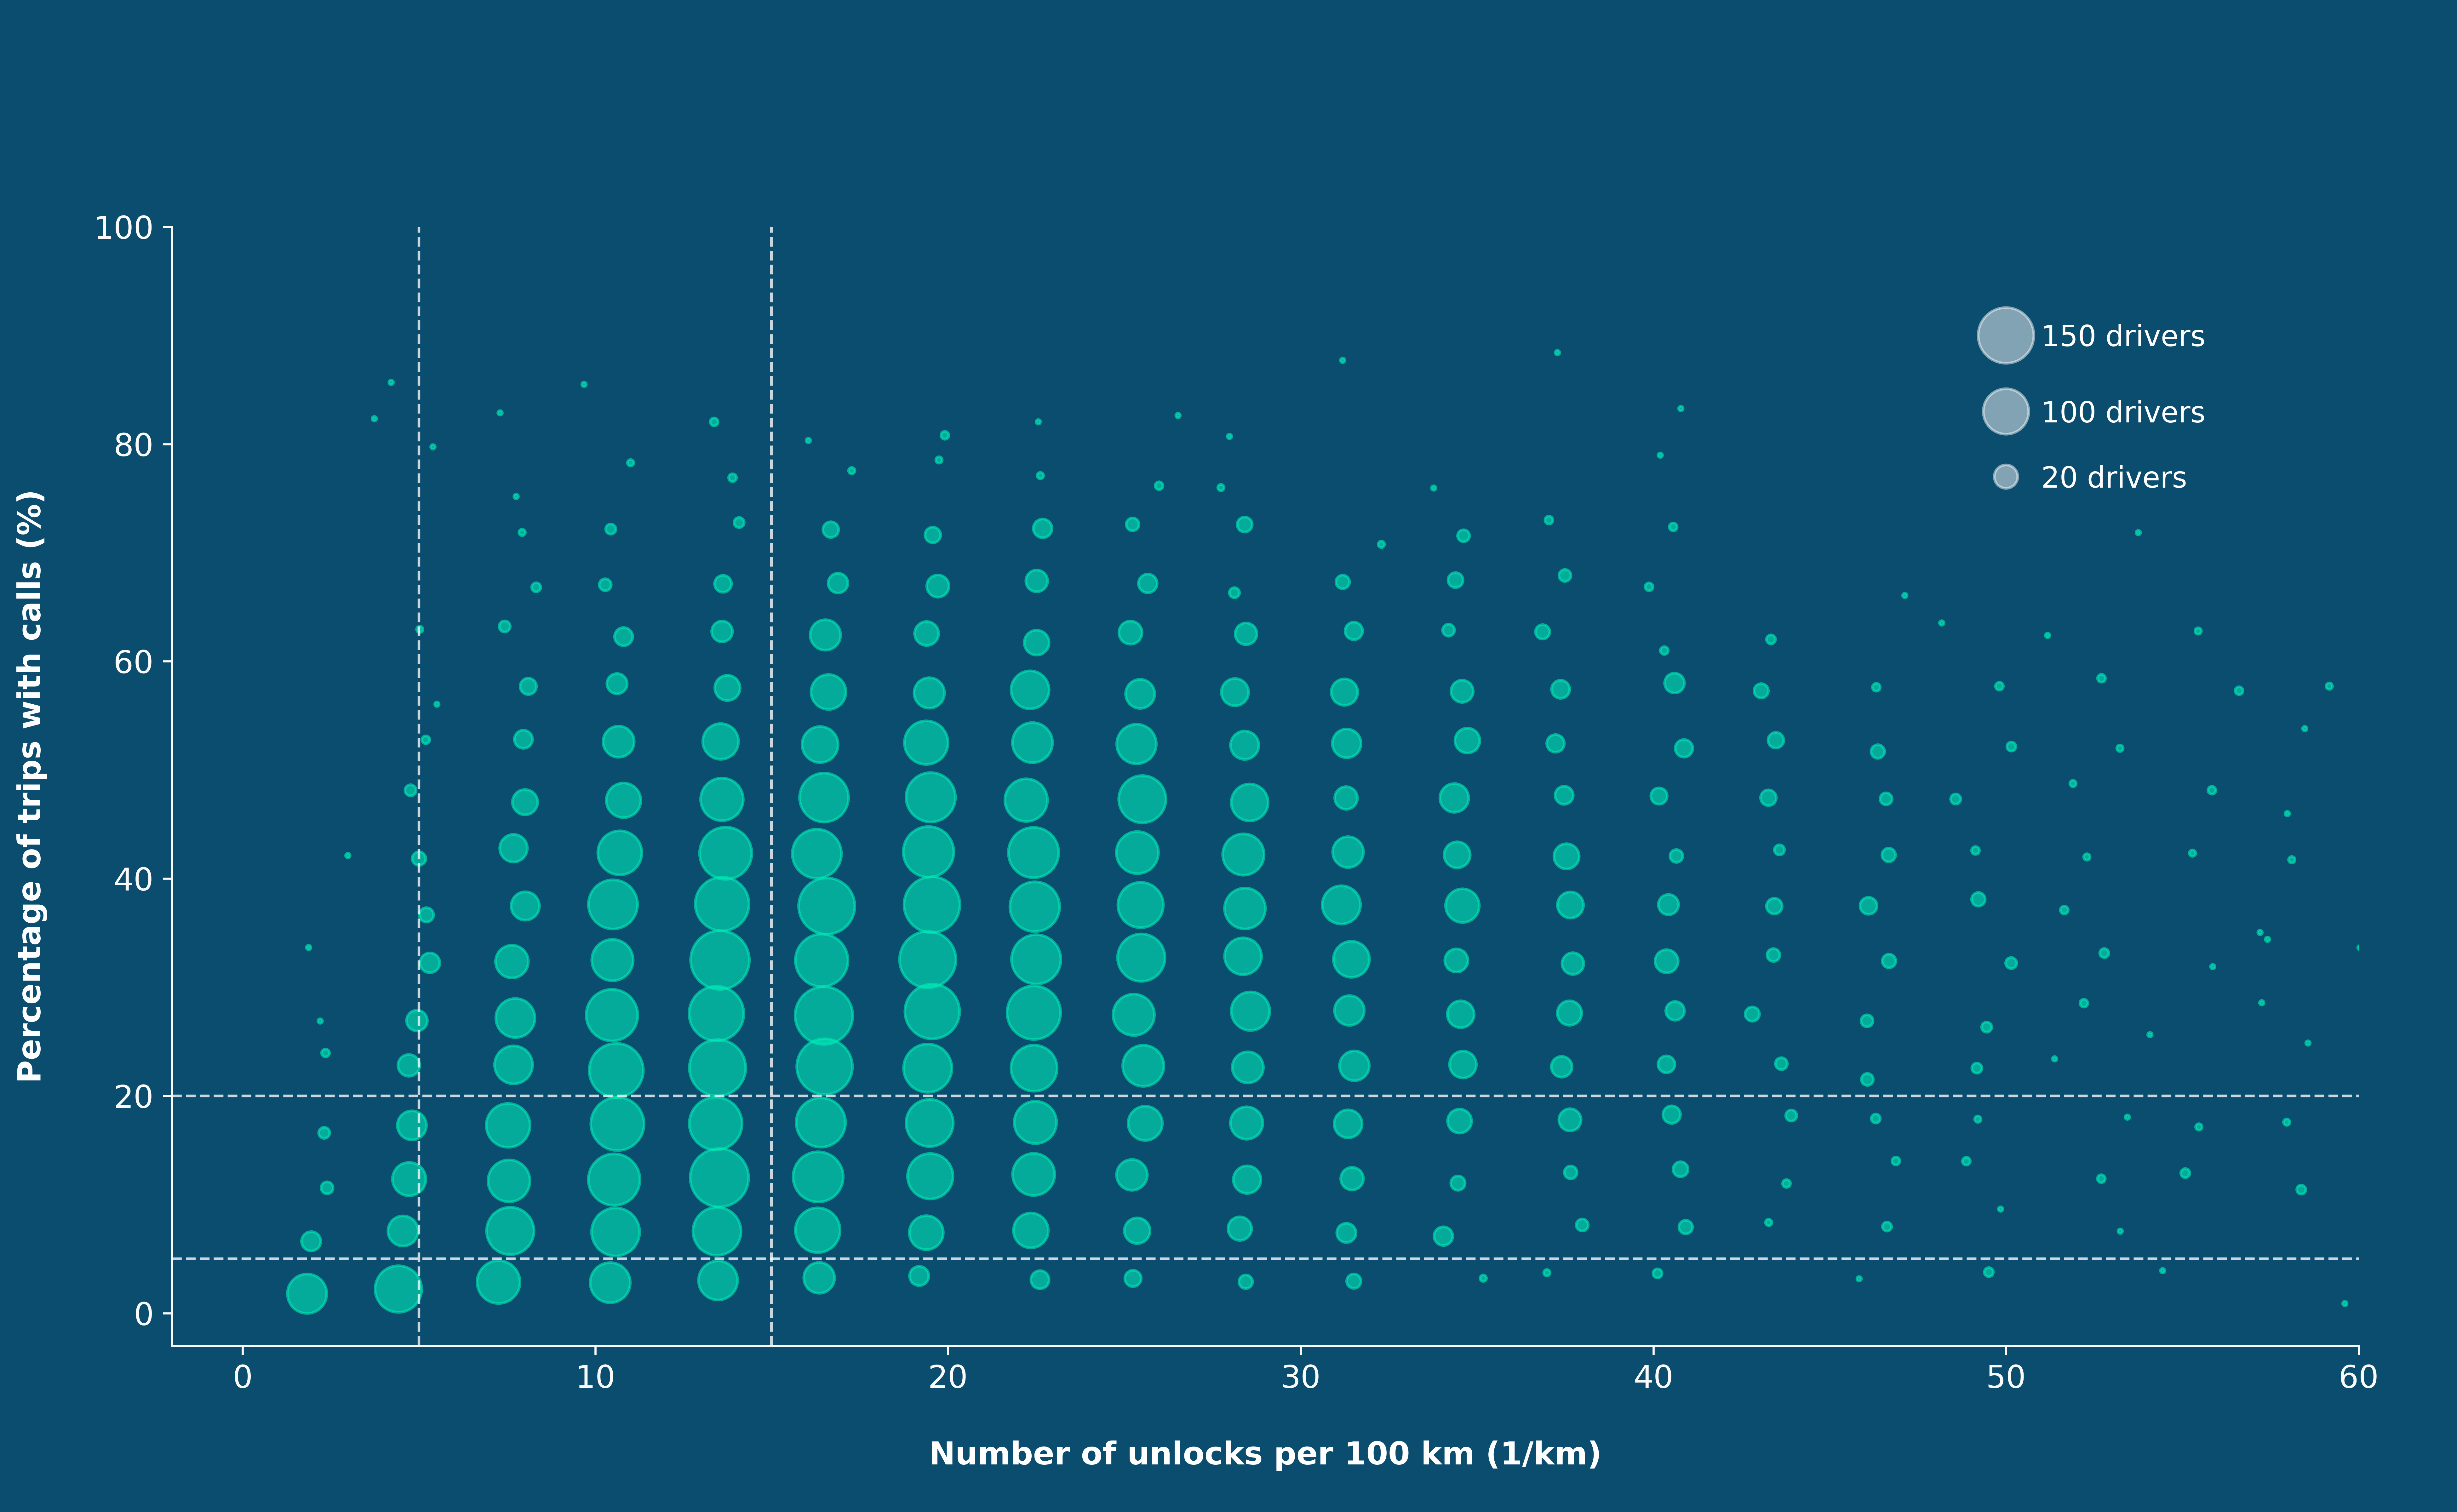
Figure 5 - Quadrant partitioning in the plane defined by the number of unlocks per 100 km and the percentage of trips with calls.
The following table indicates the number of drivers included in each quadrant:
|
Unlock frequency |
||||
|
bad |
average |
good |
||
|
Percentage of trips with calls |
bad |
5 536 |
2 092 |
45 |
|
average |
1 345 |
1 133 |
114 |
|
|
good |
129 |
280 |
170 |
|
The findings presented above have not been altered by the new reference system. It can be seen that the group of drivers under consideration still has a high level of phone use while driving, with over 50% of drivers unlocking their phones and making forbidden calls frequently.
Figure 6 shows the average values for the number of unlockings per 100 km and call duration in seconds per trip for each driver. We have divided two-dimensional reference system into 9 quadrants, with the following thresholds:
-
Unlock frequency:
-
Good: less than 5 unlocks per 100 km.
-
Average: between 5 and 15 unlocks per 100 km.
-
Poor: more than 15 unlocks per 100 km.
-
-
Call duration:
-
Good: call duration is less than 20 seconds per trip.
-
Average: call duration between 20 and 60 seconds per trip.
-
Poor: call duration exceeds 60 seconds per trip.
-
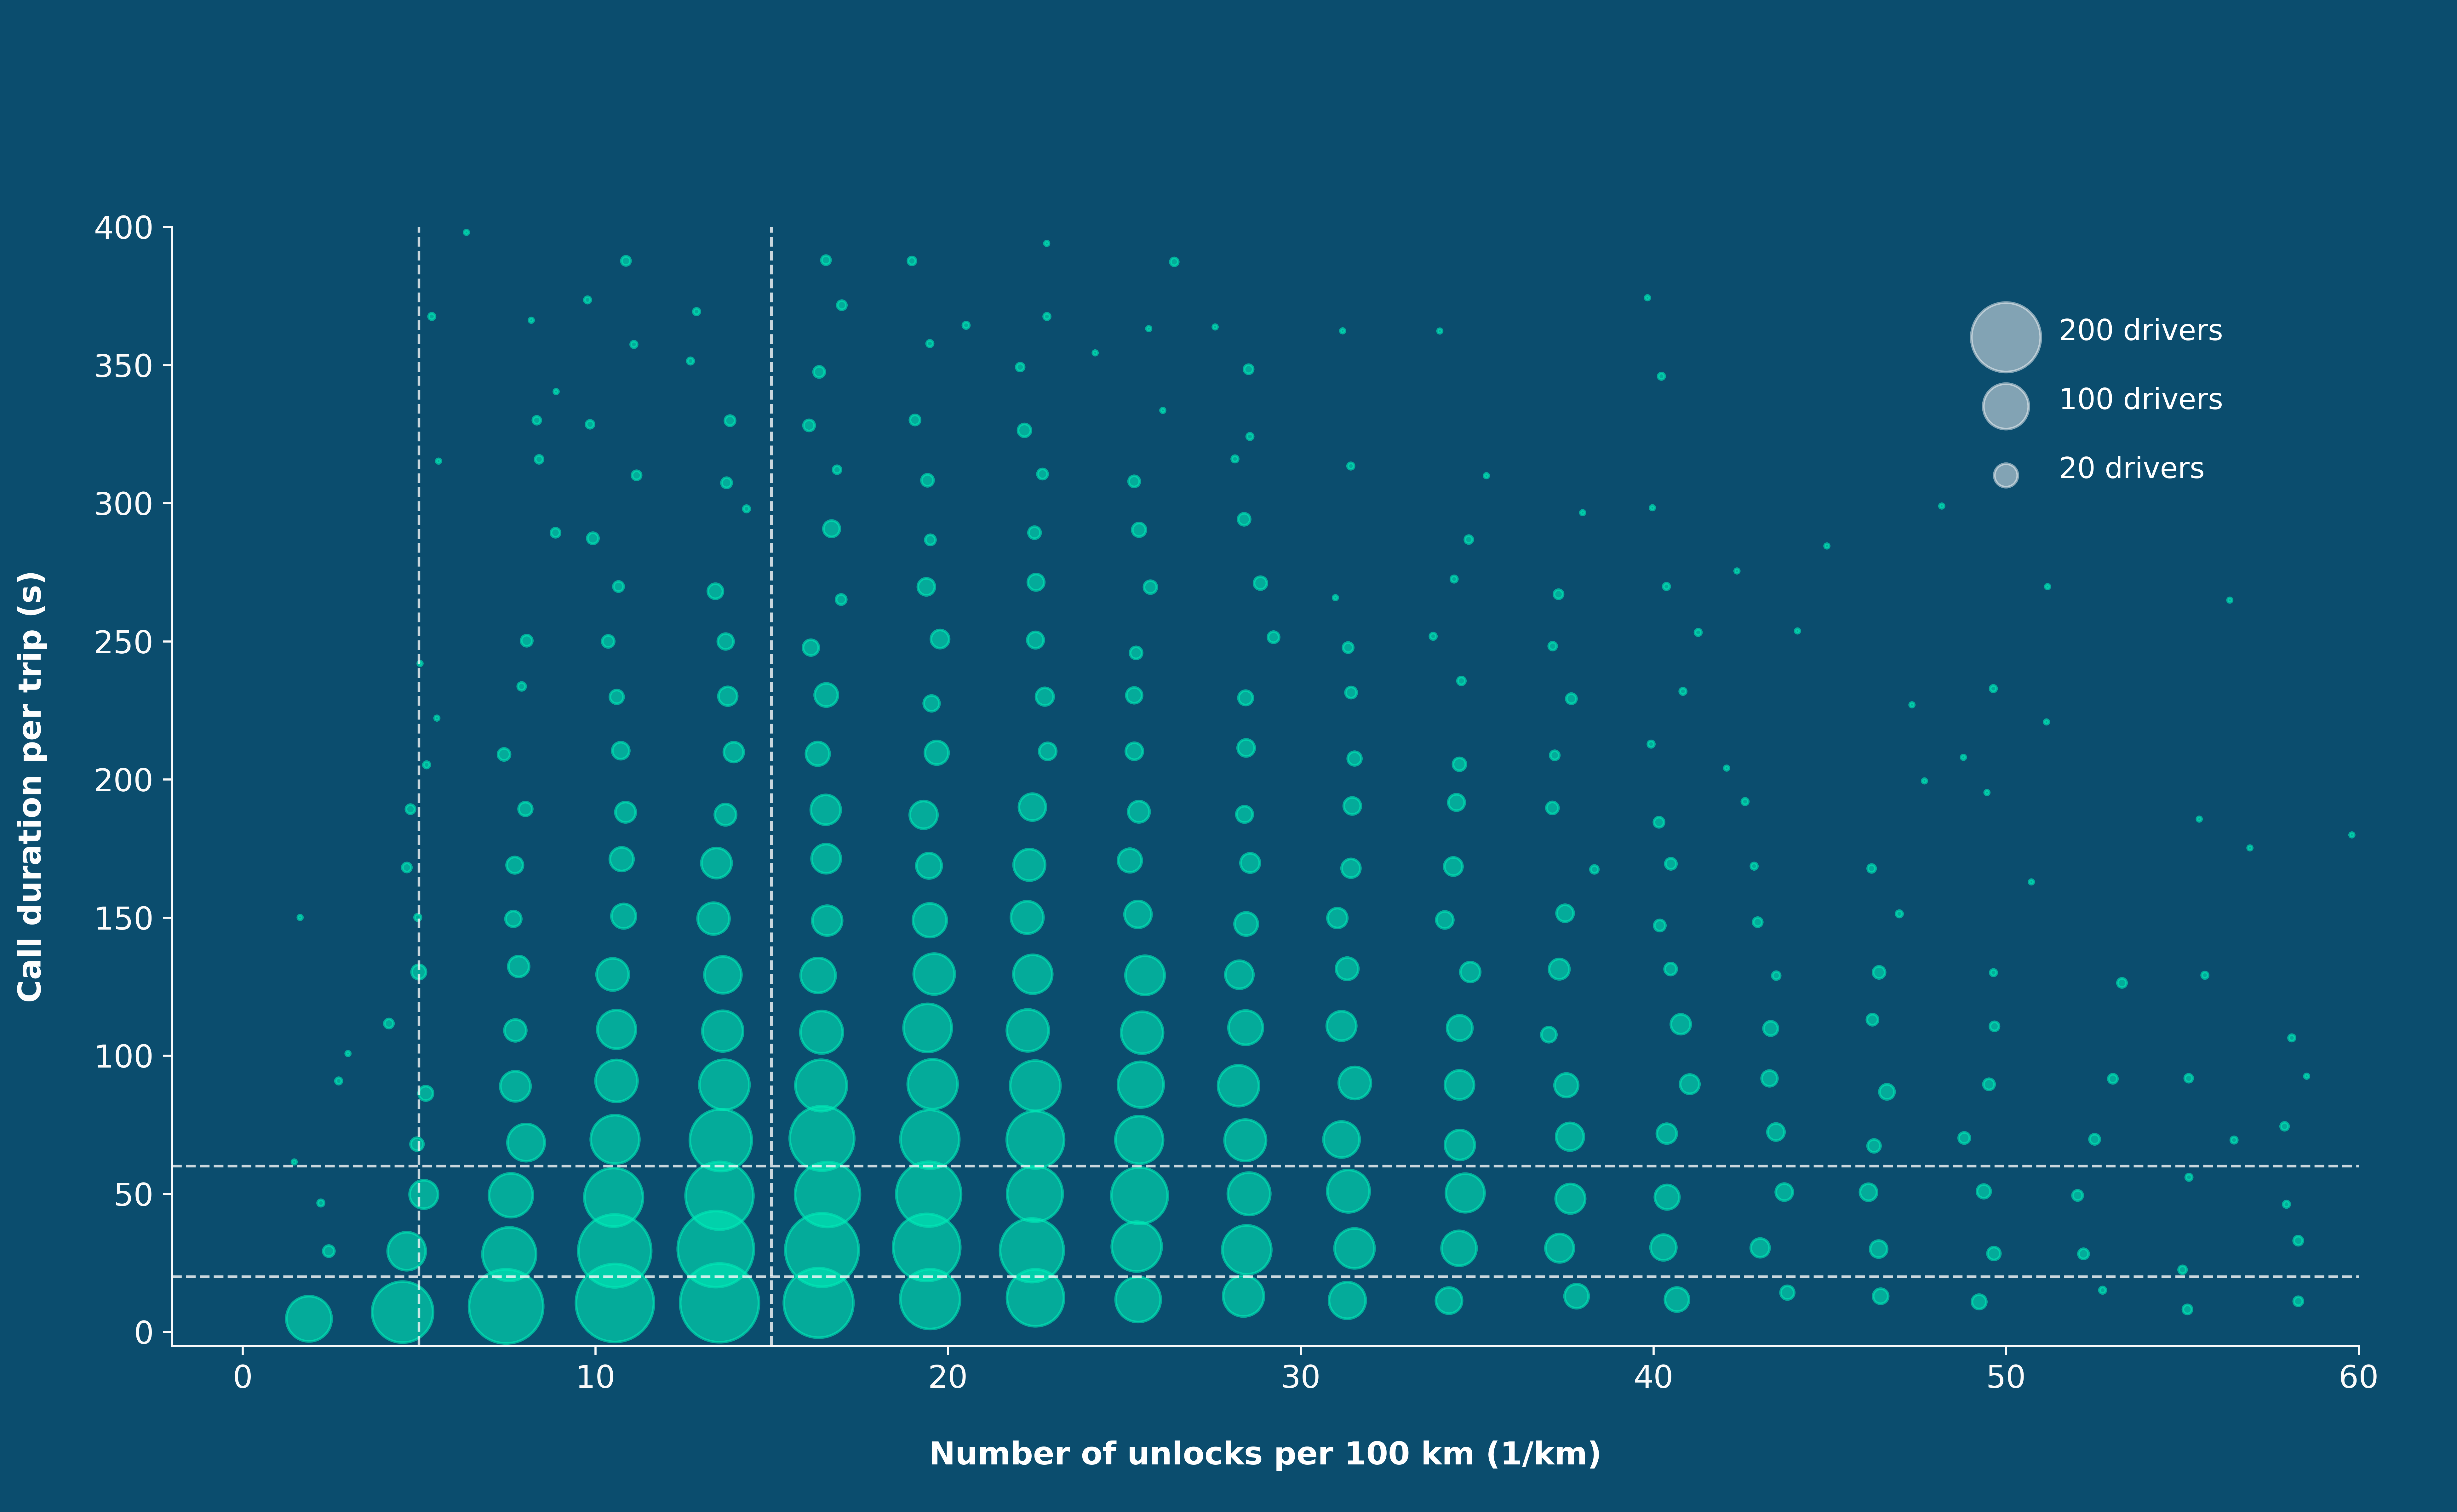
Figure 6 - Quadrant partitioning in the plane defined by the number of unlocks per 100 km and the call duration per trip.
The following table indicates the number of drivers included in each quadrant:
|
Unlock frequency |
||||
|
bad |
average |
good |
||
|
Call duration |
bad |
3 808 |
1 363 |
29 |
|
average |
2 254 |
1 216 |
58 |
|
|
good |
946 |
926 |
242 |
|
Analysis of the distraction profile of four drivers
In addition to segmenting and accurately assessing the risk of its portfolio, an insurer using our driving analysis service can analyse the individualized distraction profile of its policyholders, including the following indicators:
-
distraction habits
-
the most distraction-prone road environments
-
peak days and hours
To illustrate the potential of the individualized distraction profile, we have chosen four drivers from the community studied in Part 2, with dissimilar distraction habits. They are symbolized in Figure 7 by the letters A, B, C and D.
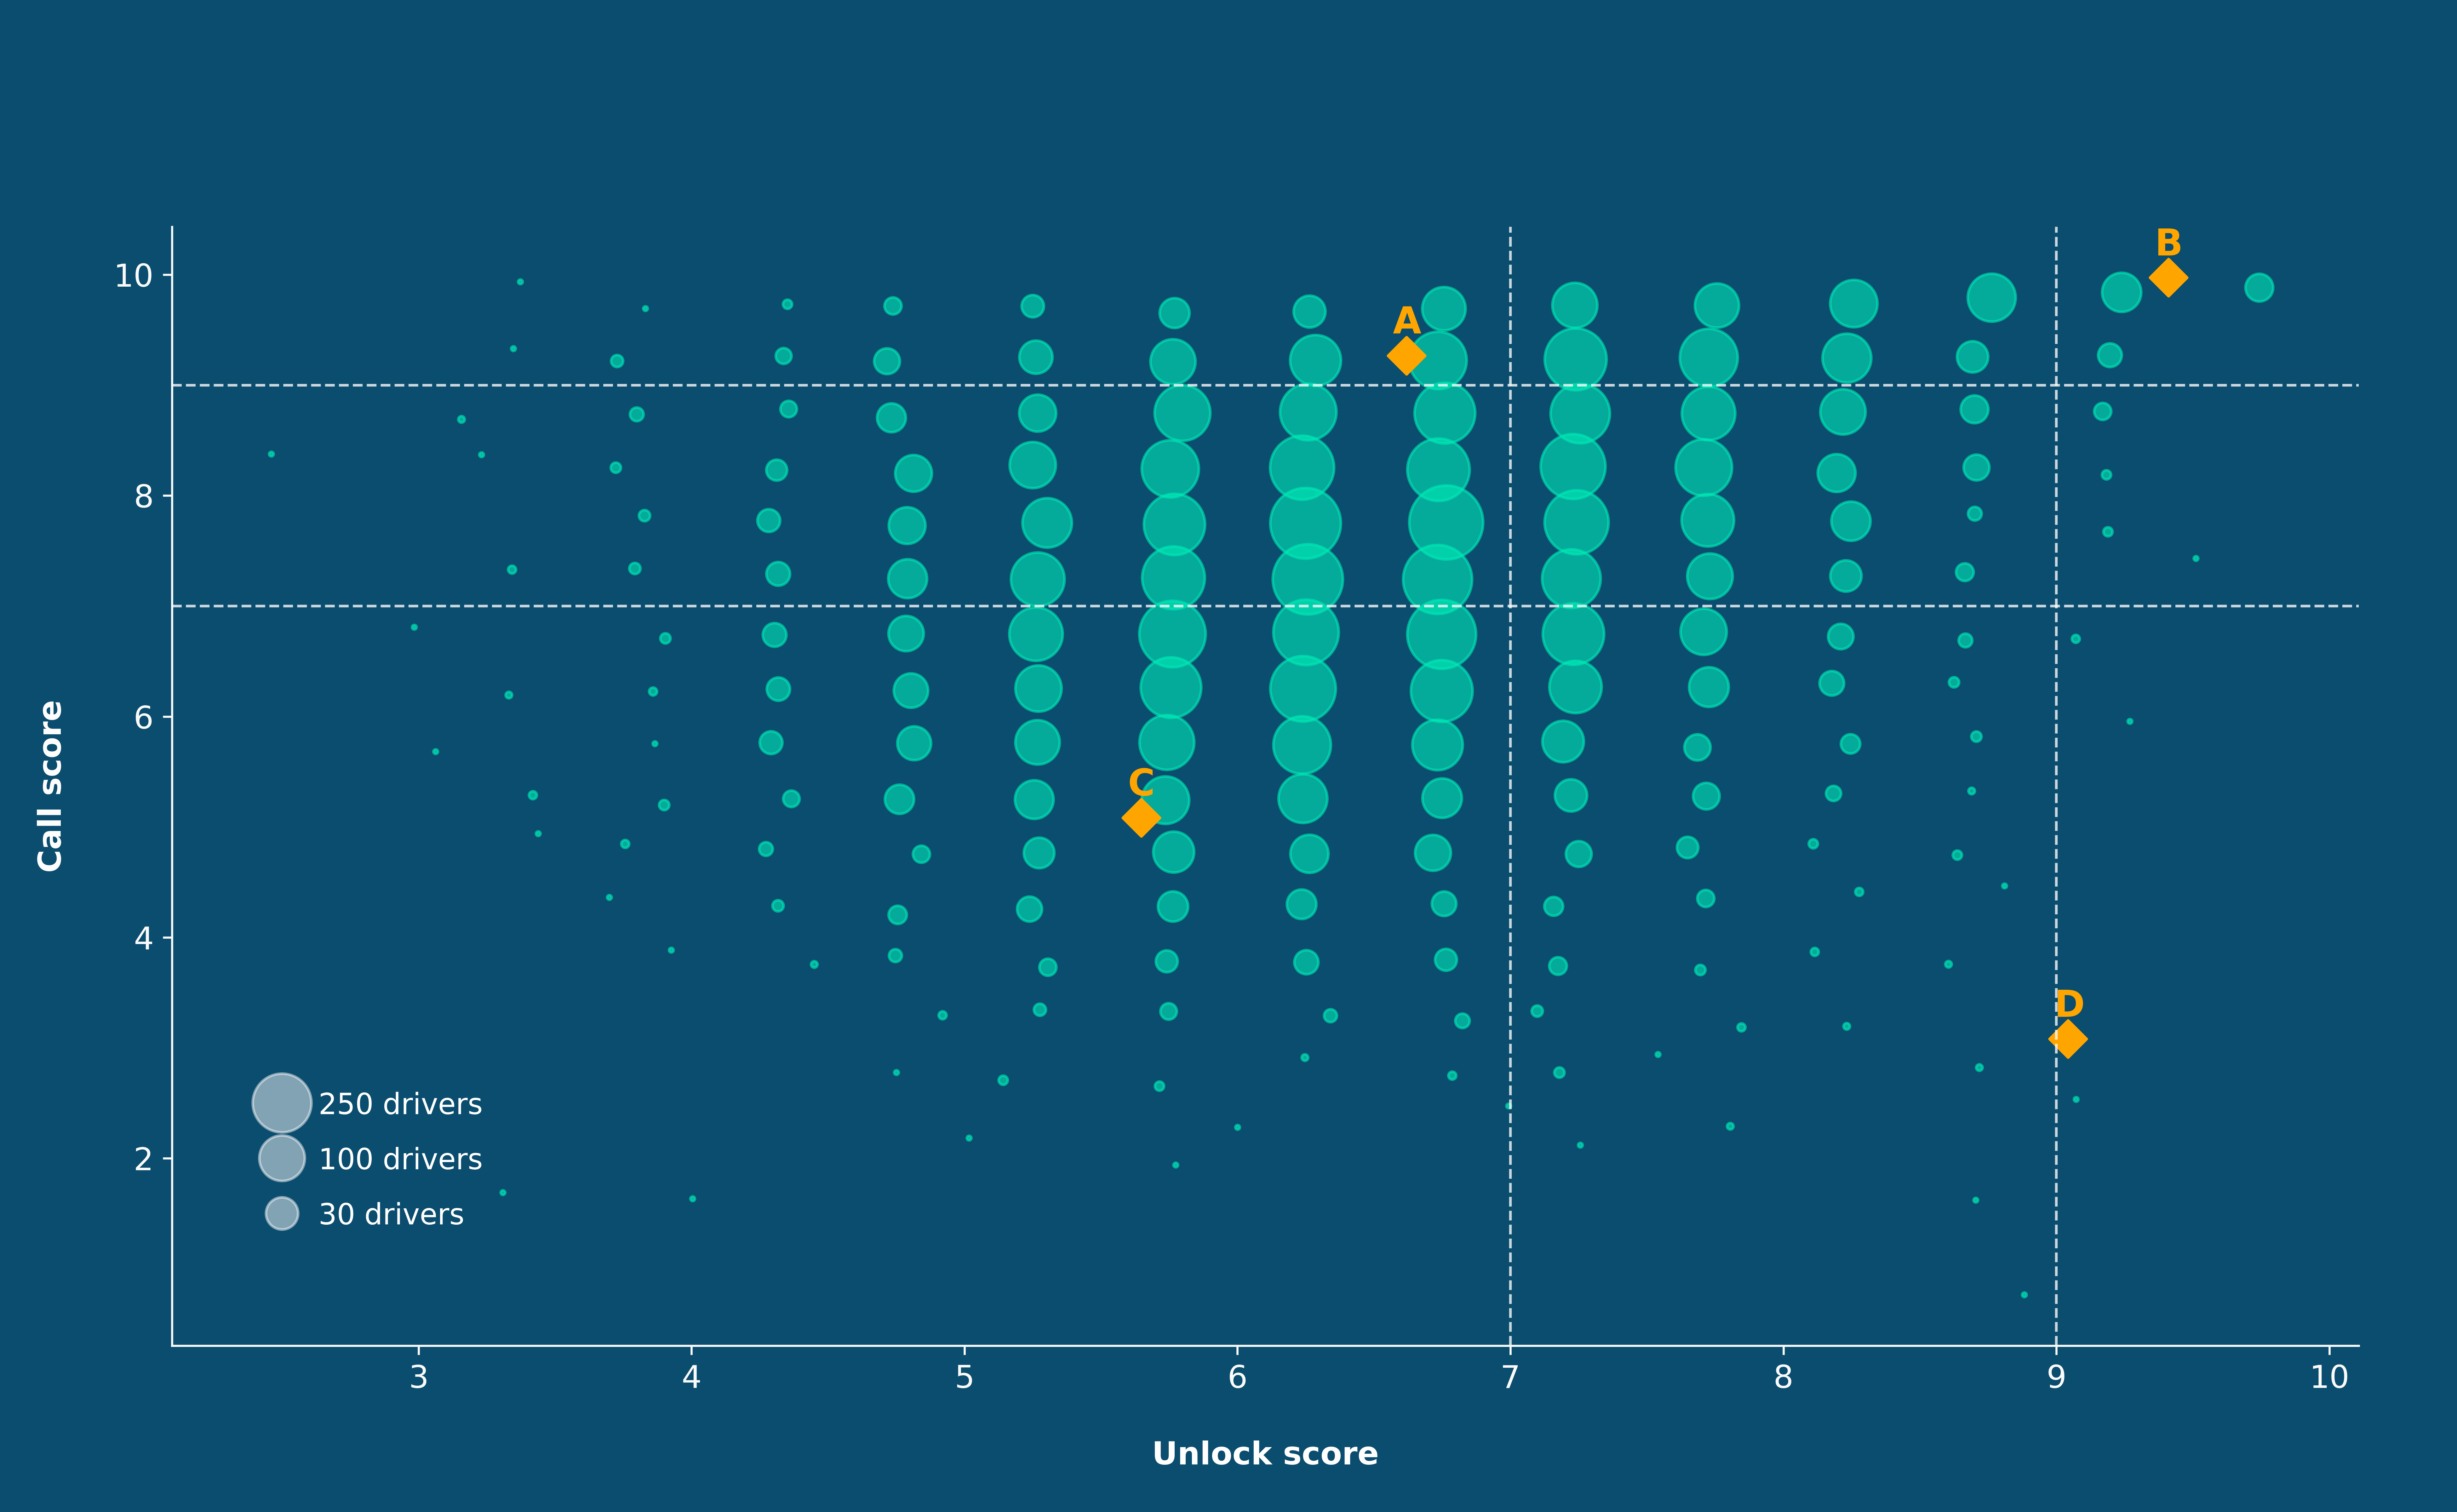
Figure 7 - Selection of 4 drivers with different phone usage patterns.
Drivers A and D have opposite distraction habits:
-
Driver A reads or sends messages but never makes phone calls.
-
Driver D uses his phone to make calls but never to check messages.
-
Driver B is very little distracted.
-
Driver C is frequently distracted by phone calls or mobile applications.
Distraction habits
Figures 8 and 9 show the statistical analysis of distraction events for all 4 drivers' trips. For each driver, we can determine the median value of the number of unlocks per trip (Figure 8), as well as the call duration (Figure 9).
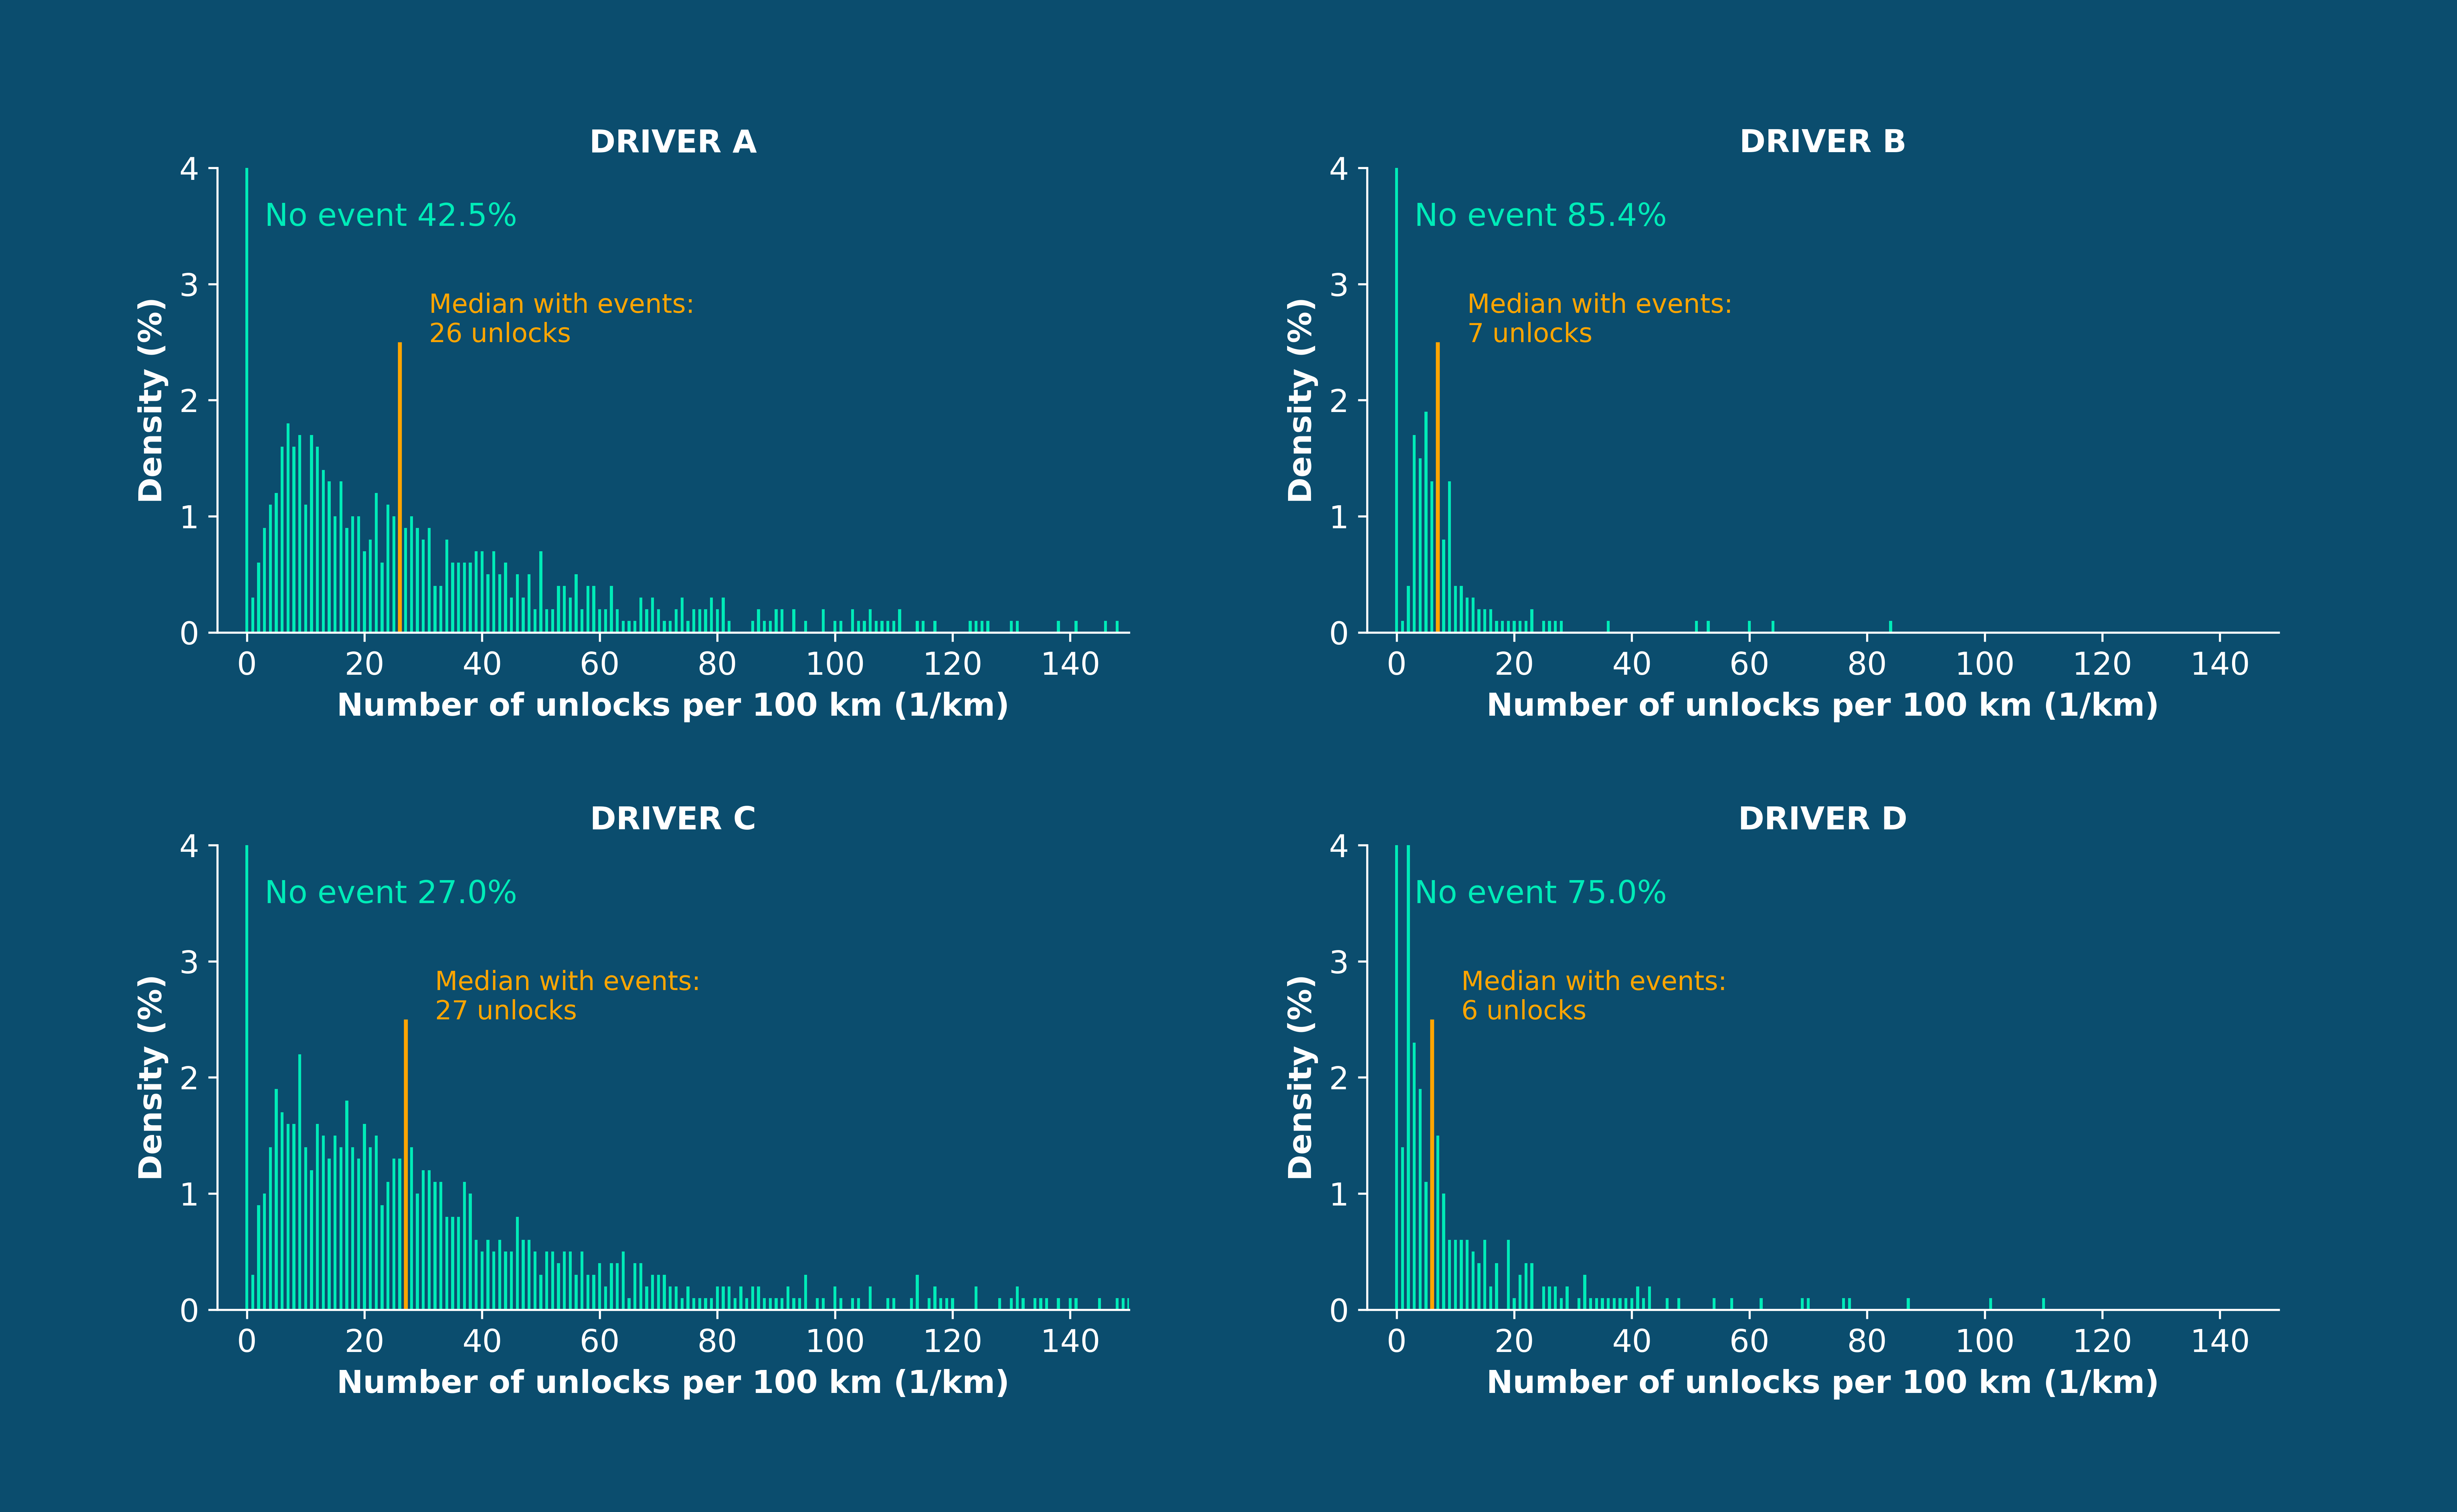
Figure 8 - Distribution of unlock scores for the 4 selected drivers.
Driver C manipulates his phone about once every 4 kilometers. Only 27% of his trips are completed without any unlocking. In contrast, Driver B uses his phone less than once every 10 kilometers. Around 85% of his trips are distraction-free.
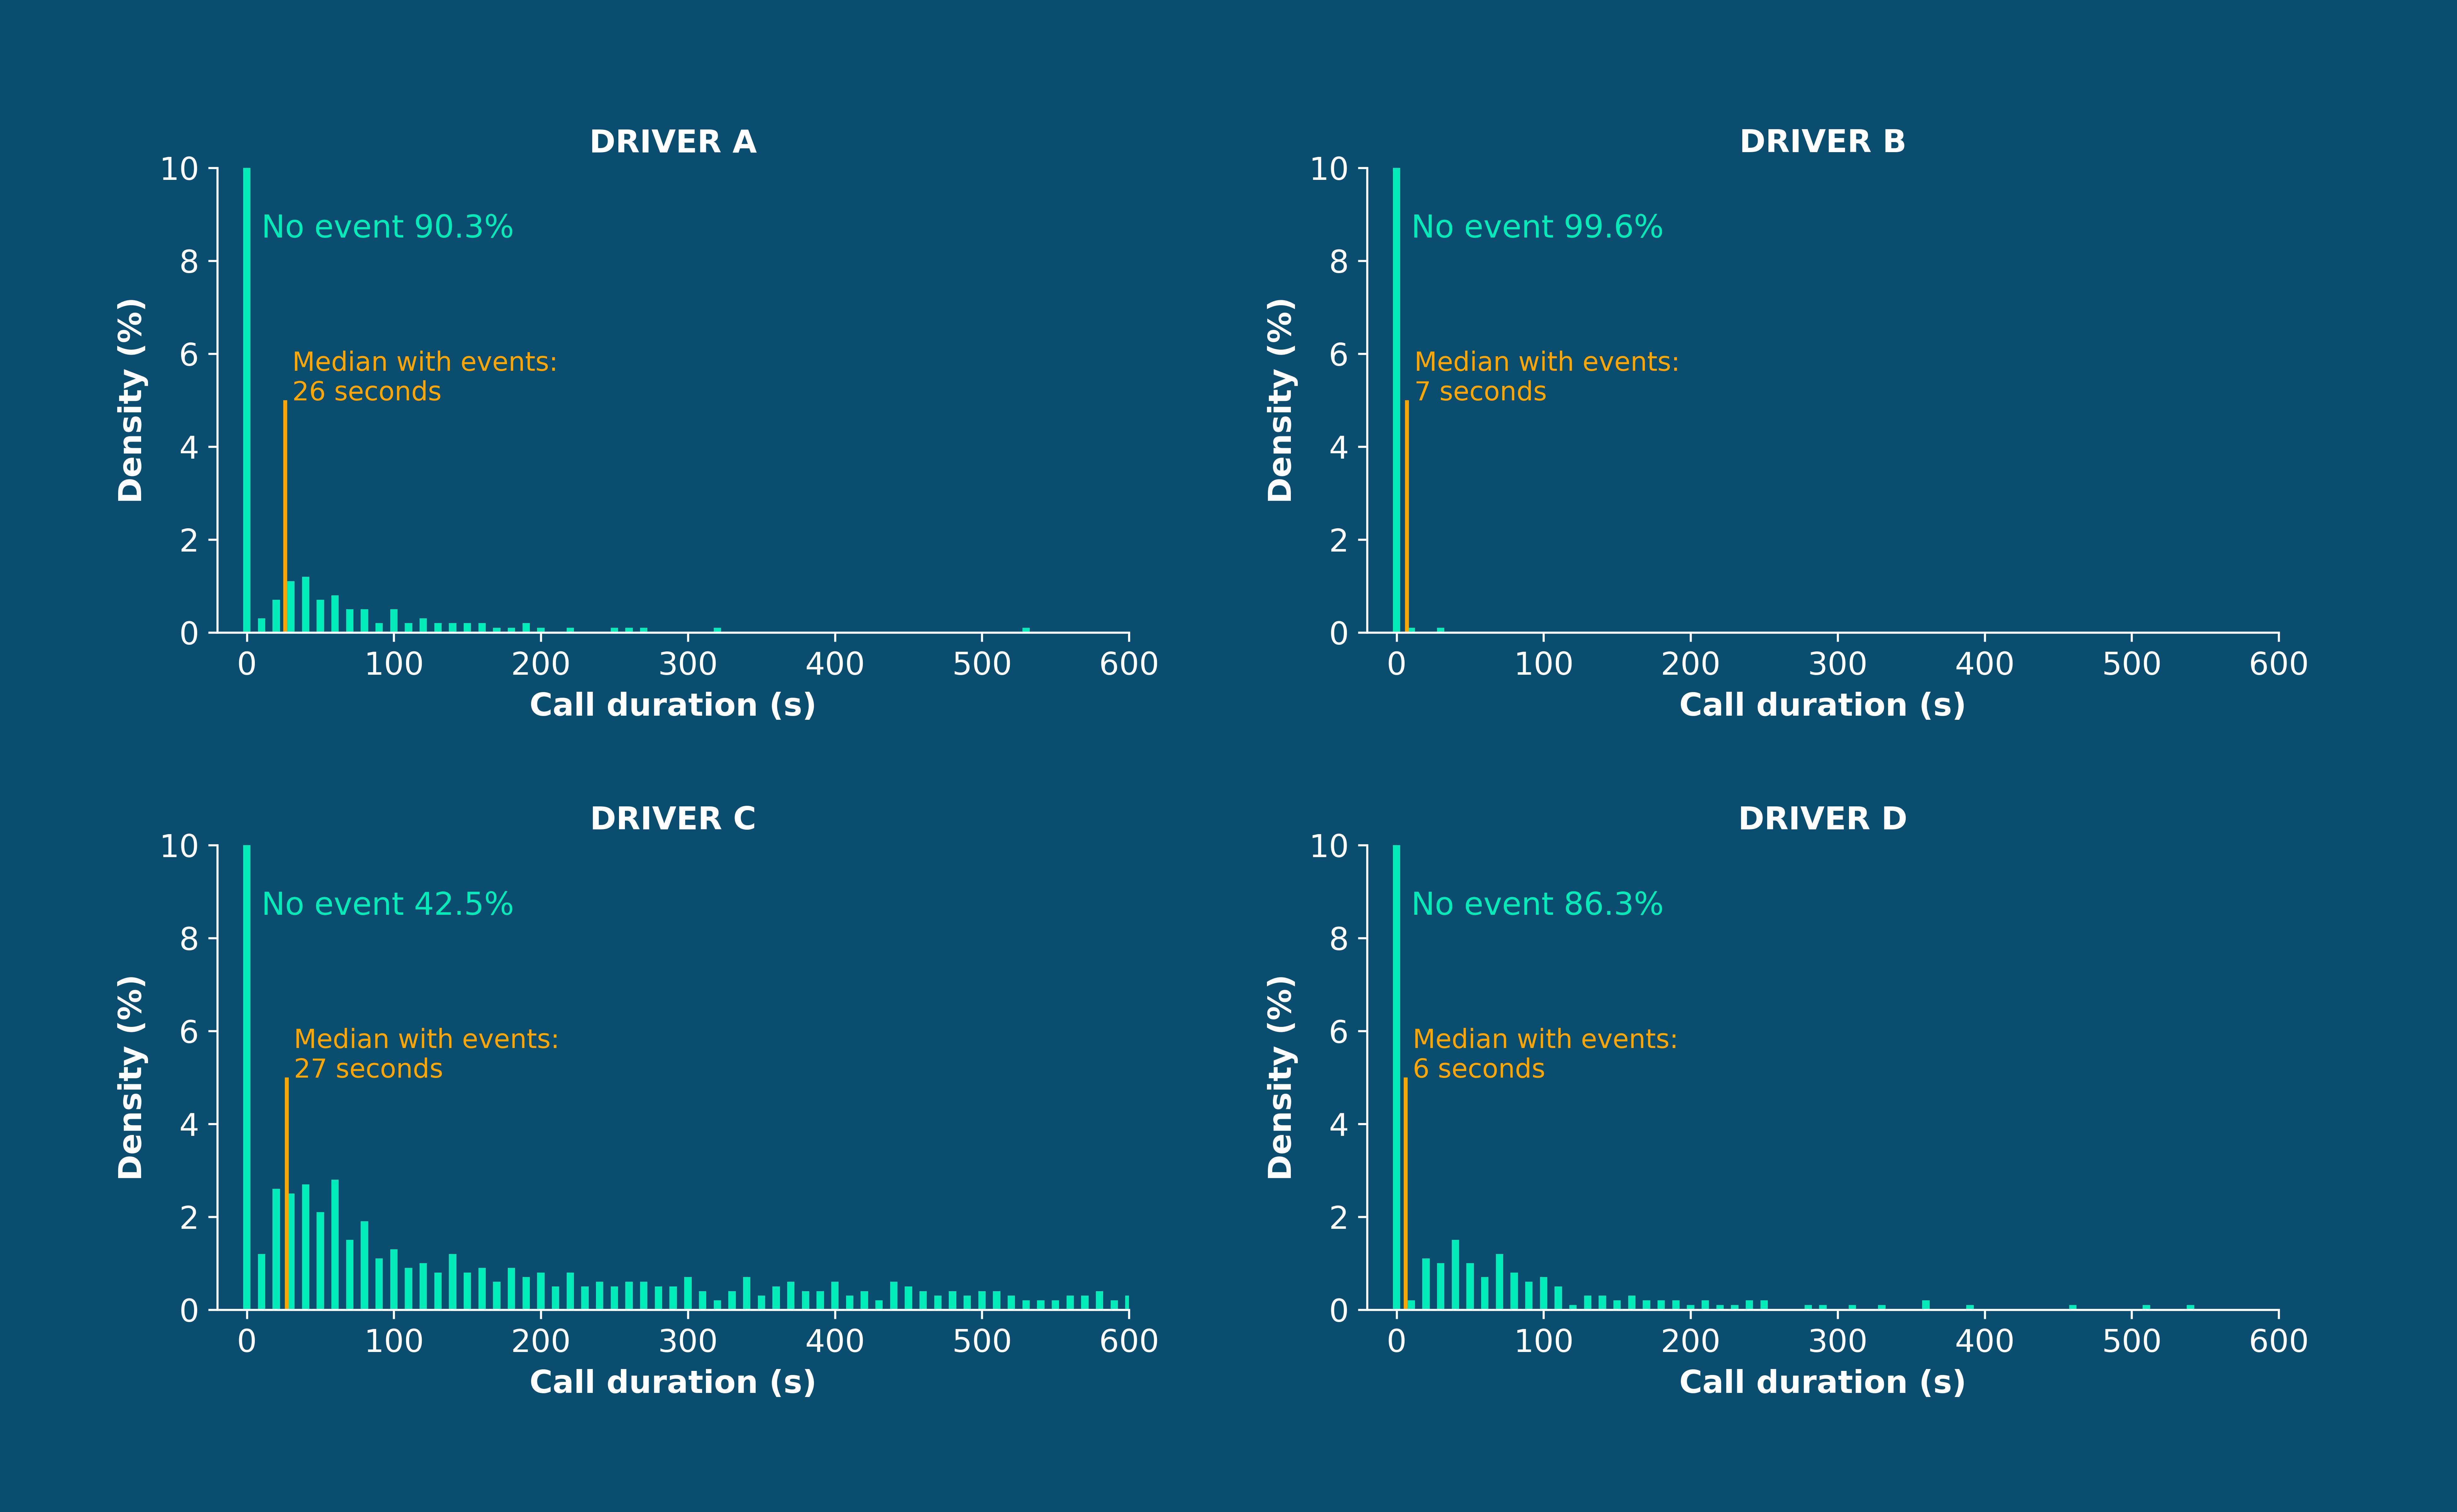
Figure 9 - Distribution of call scores for the 4 selected drivers.
An analysis of the duration of phone calls reveals that 60% of driver C's car trips involve forbidden calls. Driver B's phone calls are very rare and much shorter than those of drivers A and D.
Thanks to the statistical analysis of distraction events, insurers can obtain very precise information on a driver's distraction habits:
- number of trips with and without unlock,
- number of trips with and without a call,
- median frequency of unlocks per kilometer,
- average duration of phone calls.
The resulting information can be used to enhance risk analysis, and also to help policyholders become aware of their phone use and reduce it.
Road contexts
Our solution labels each detected distraction event (unlock or phone call) and the associated road context. The road context is based on an analysis of the travel speed of all the road segments composing the trip.
Figure 10 shows the distribution of distraction events by road context for the 4 selected drivers.
 .
. 
 .
. 
Figure 10 - Distribution of distraction events by road context for the 4 selected drivers.
The analysis reveals that Driver A tends to unlock his phone frequently when his vehicle is stopped, especially in urban environments. Driver D phones or unlocks his phone both during city drives and expressways. Driver C, the most distracted, uses his phone no matter the context.
Generally speaking, the most frequently used road contexts are also the most likely to be distracted. By identifying them, an insurer can more accurately assess a driver's level of risk, as well as the probability and severity of an accident.
Peak days and hours
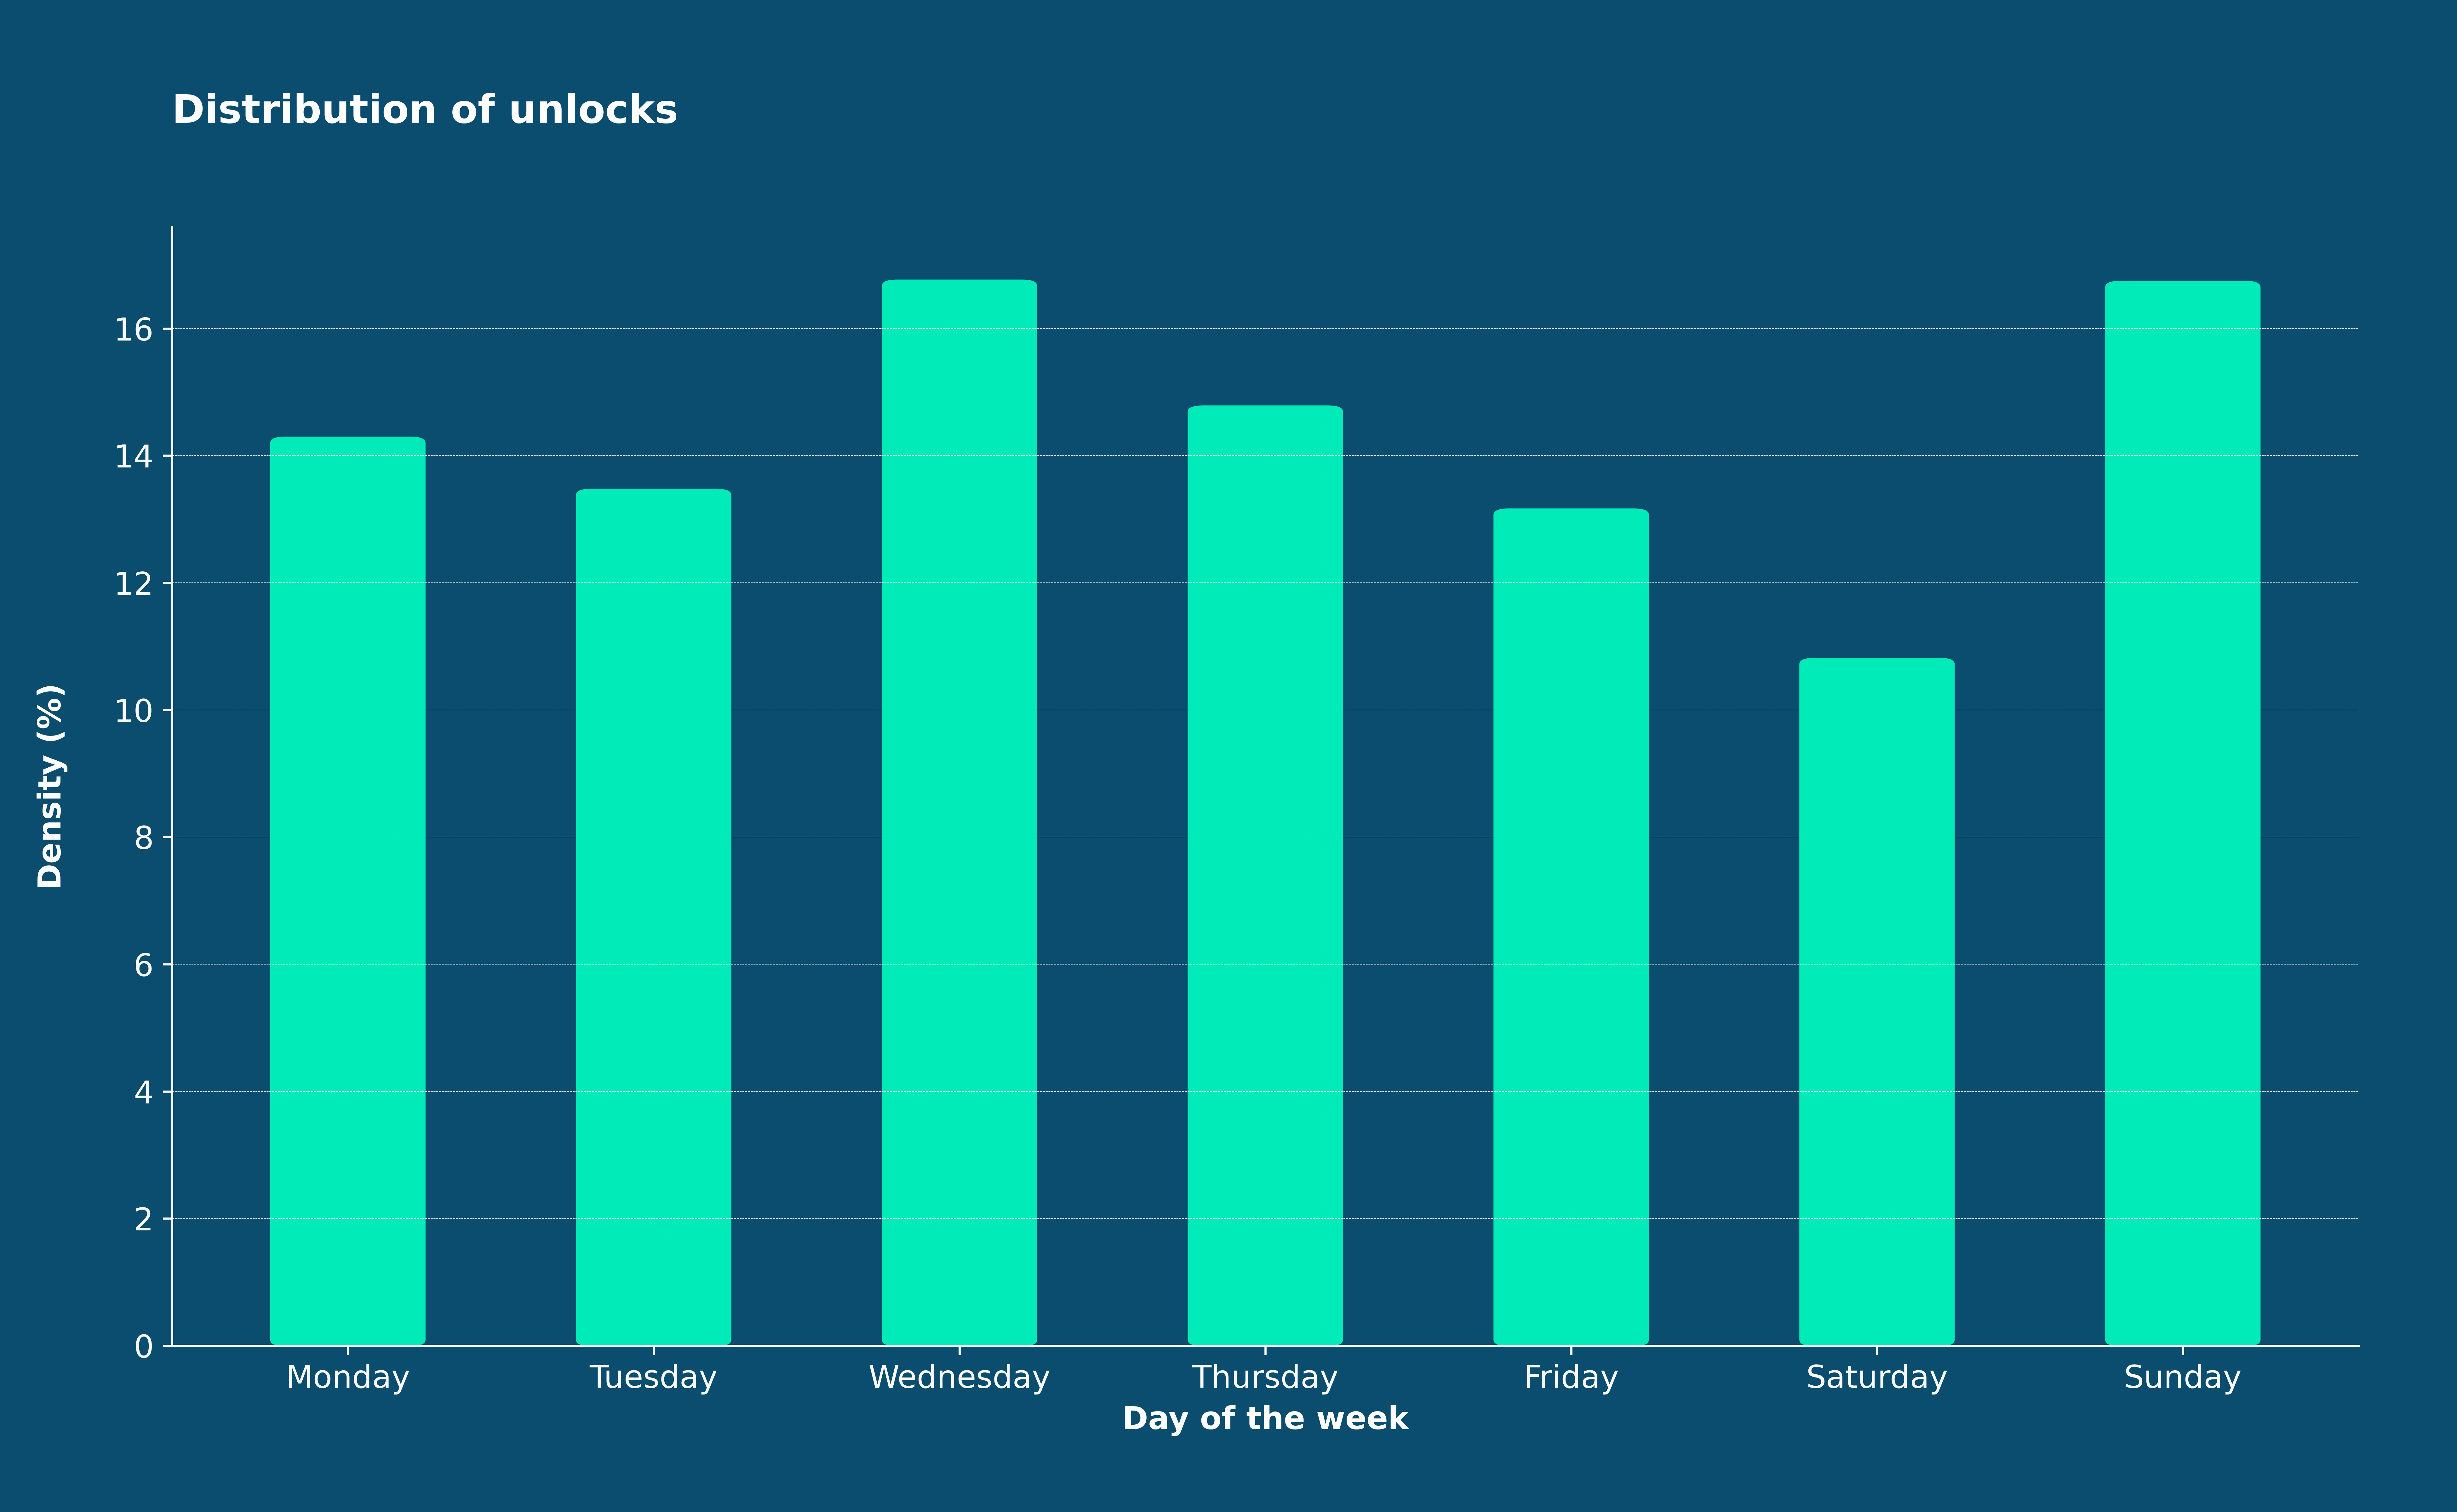
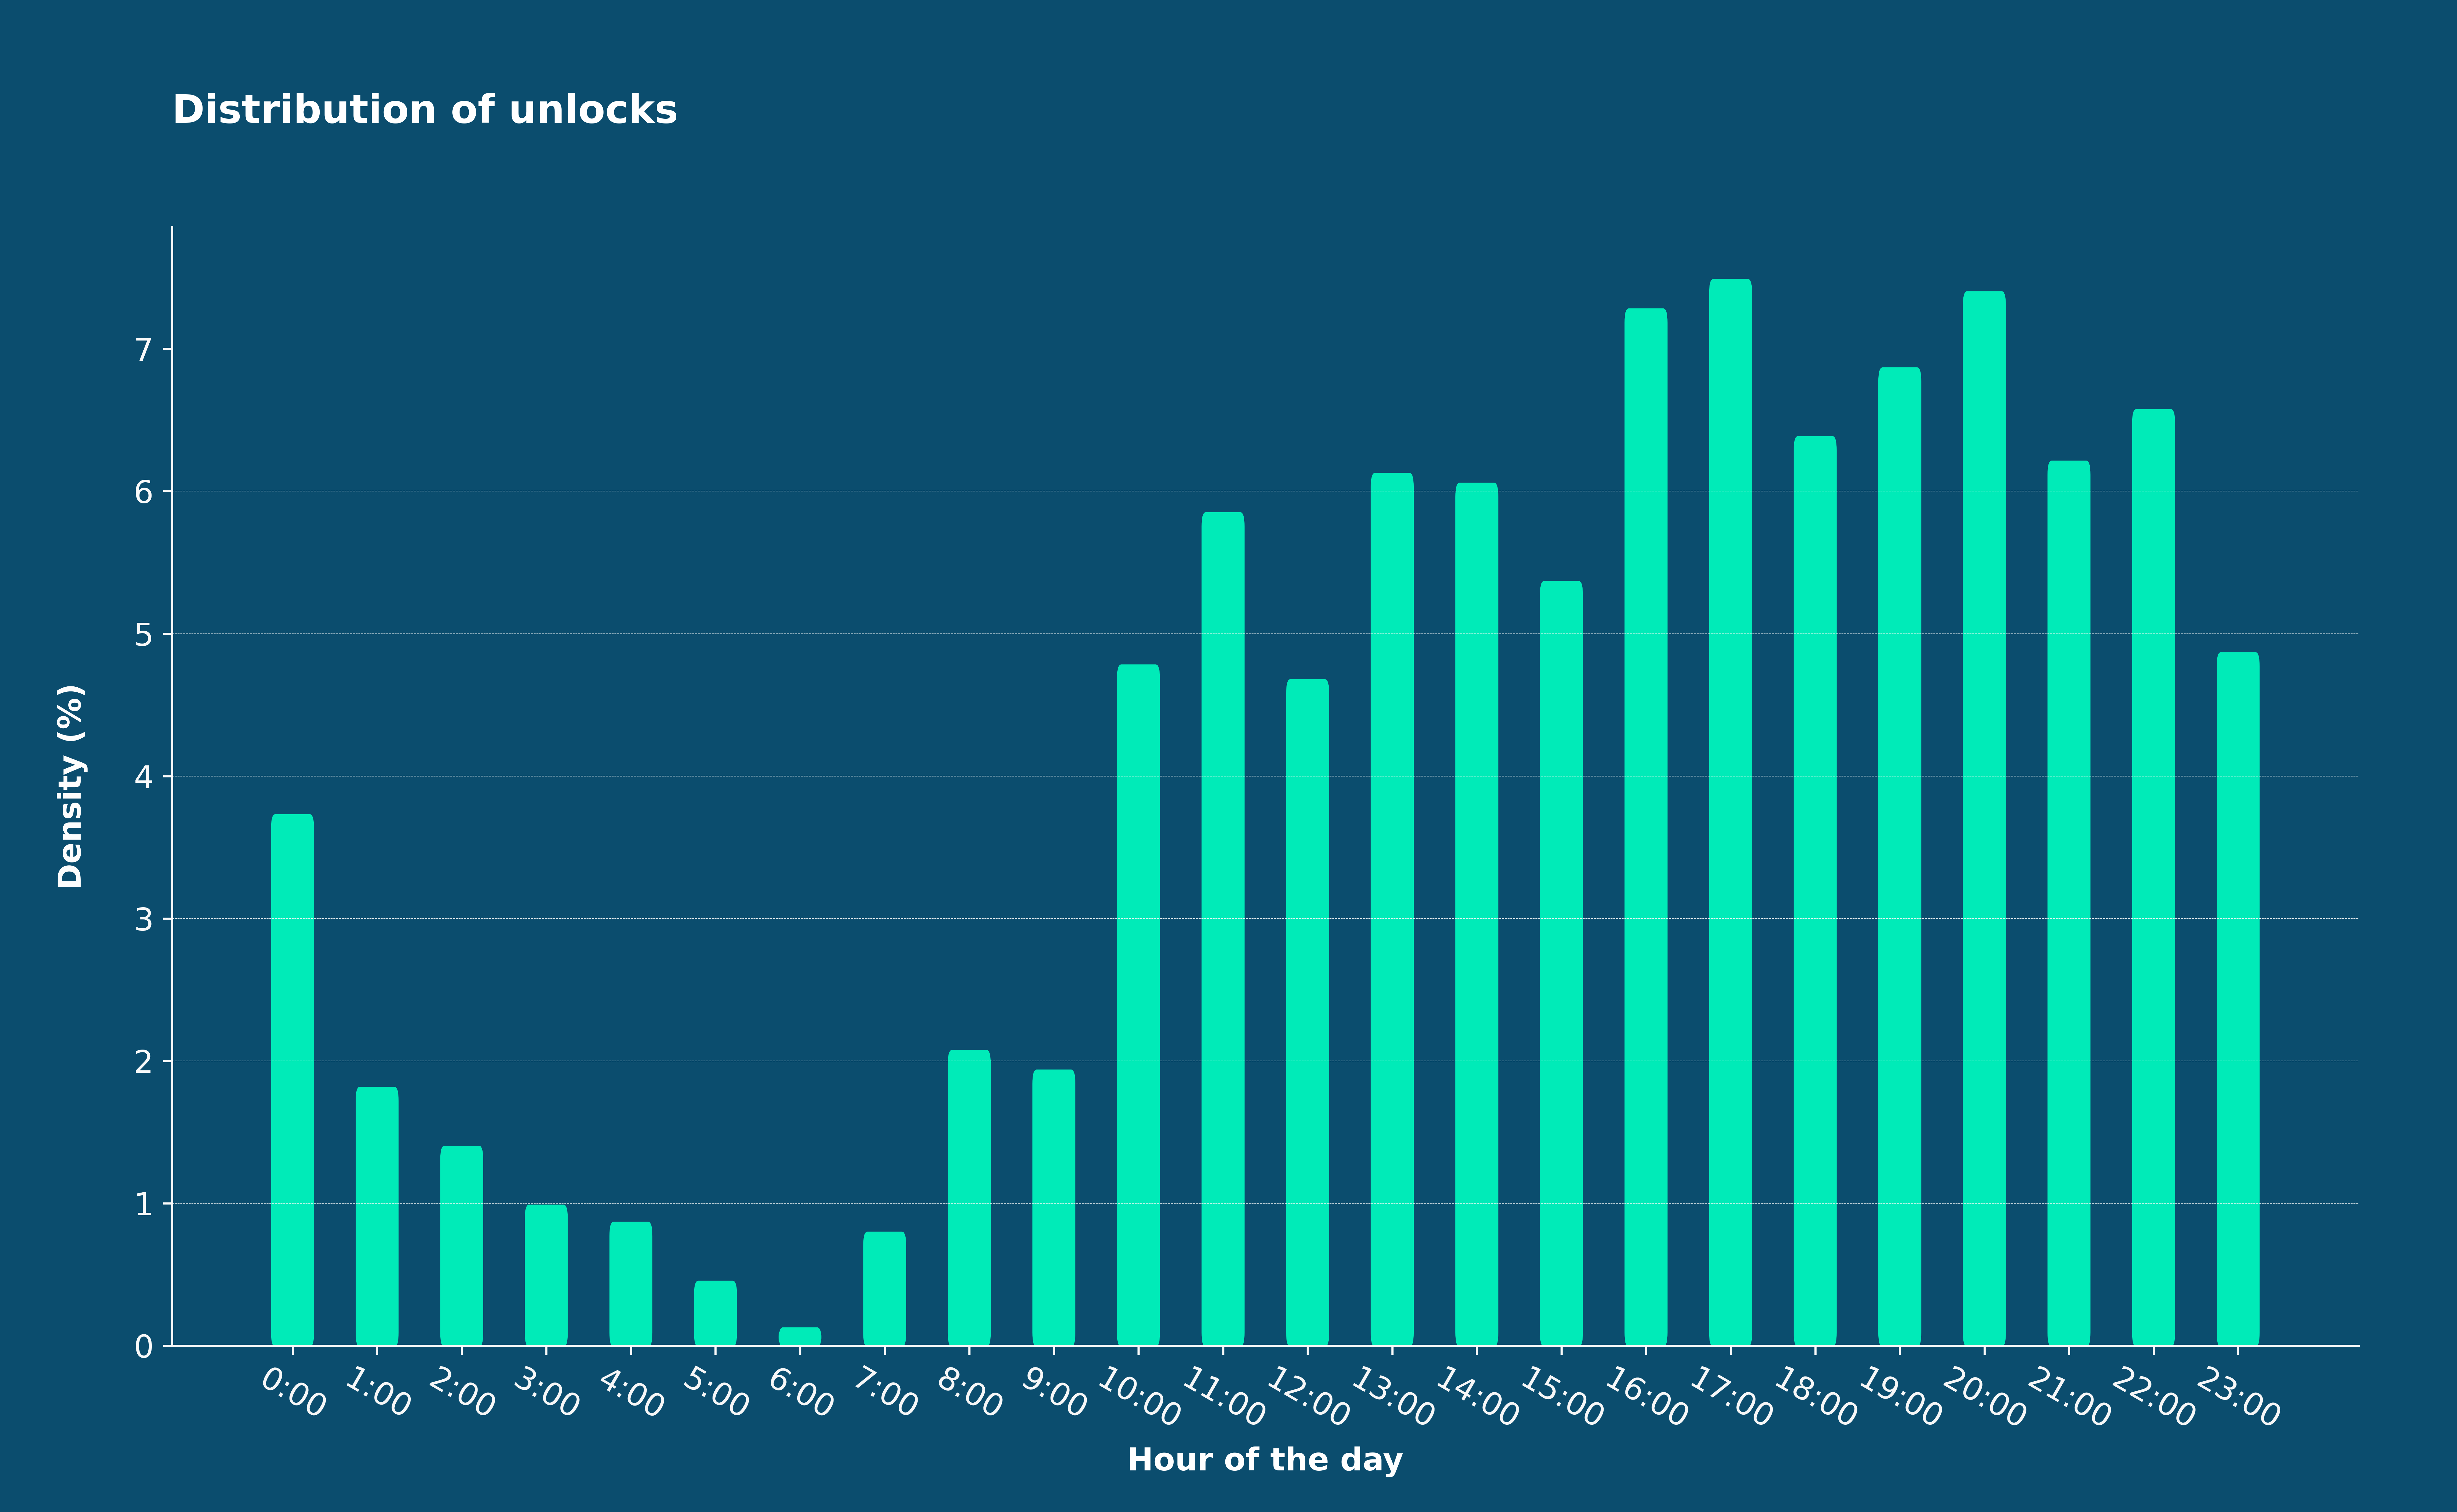
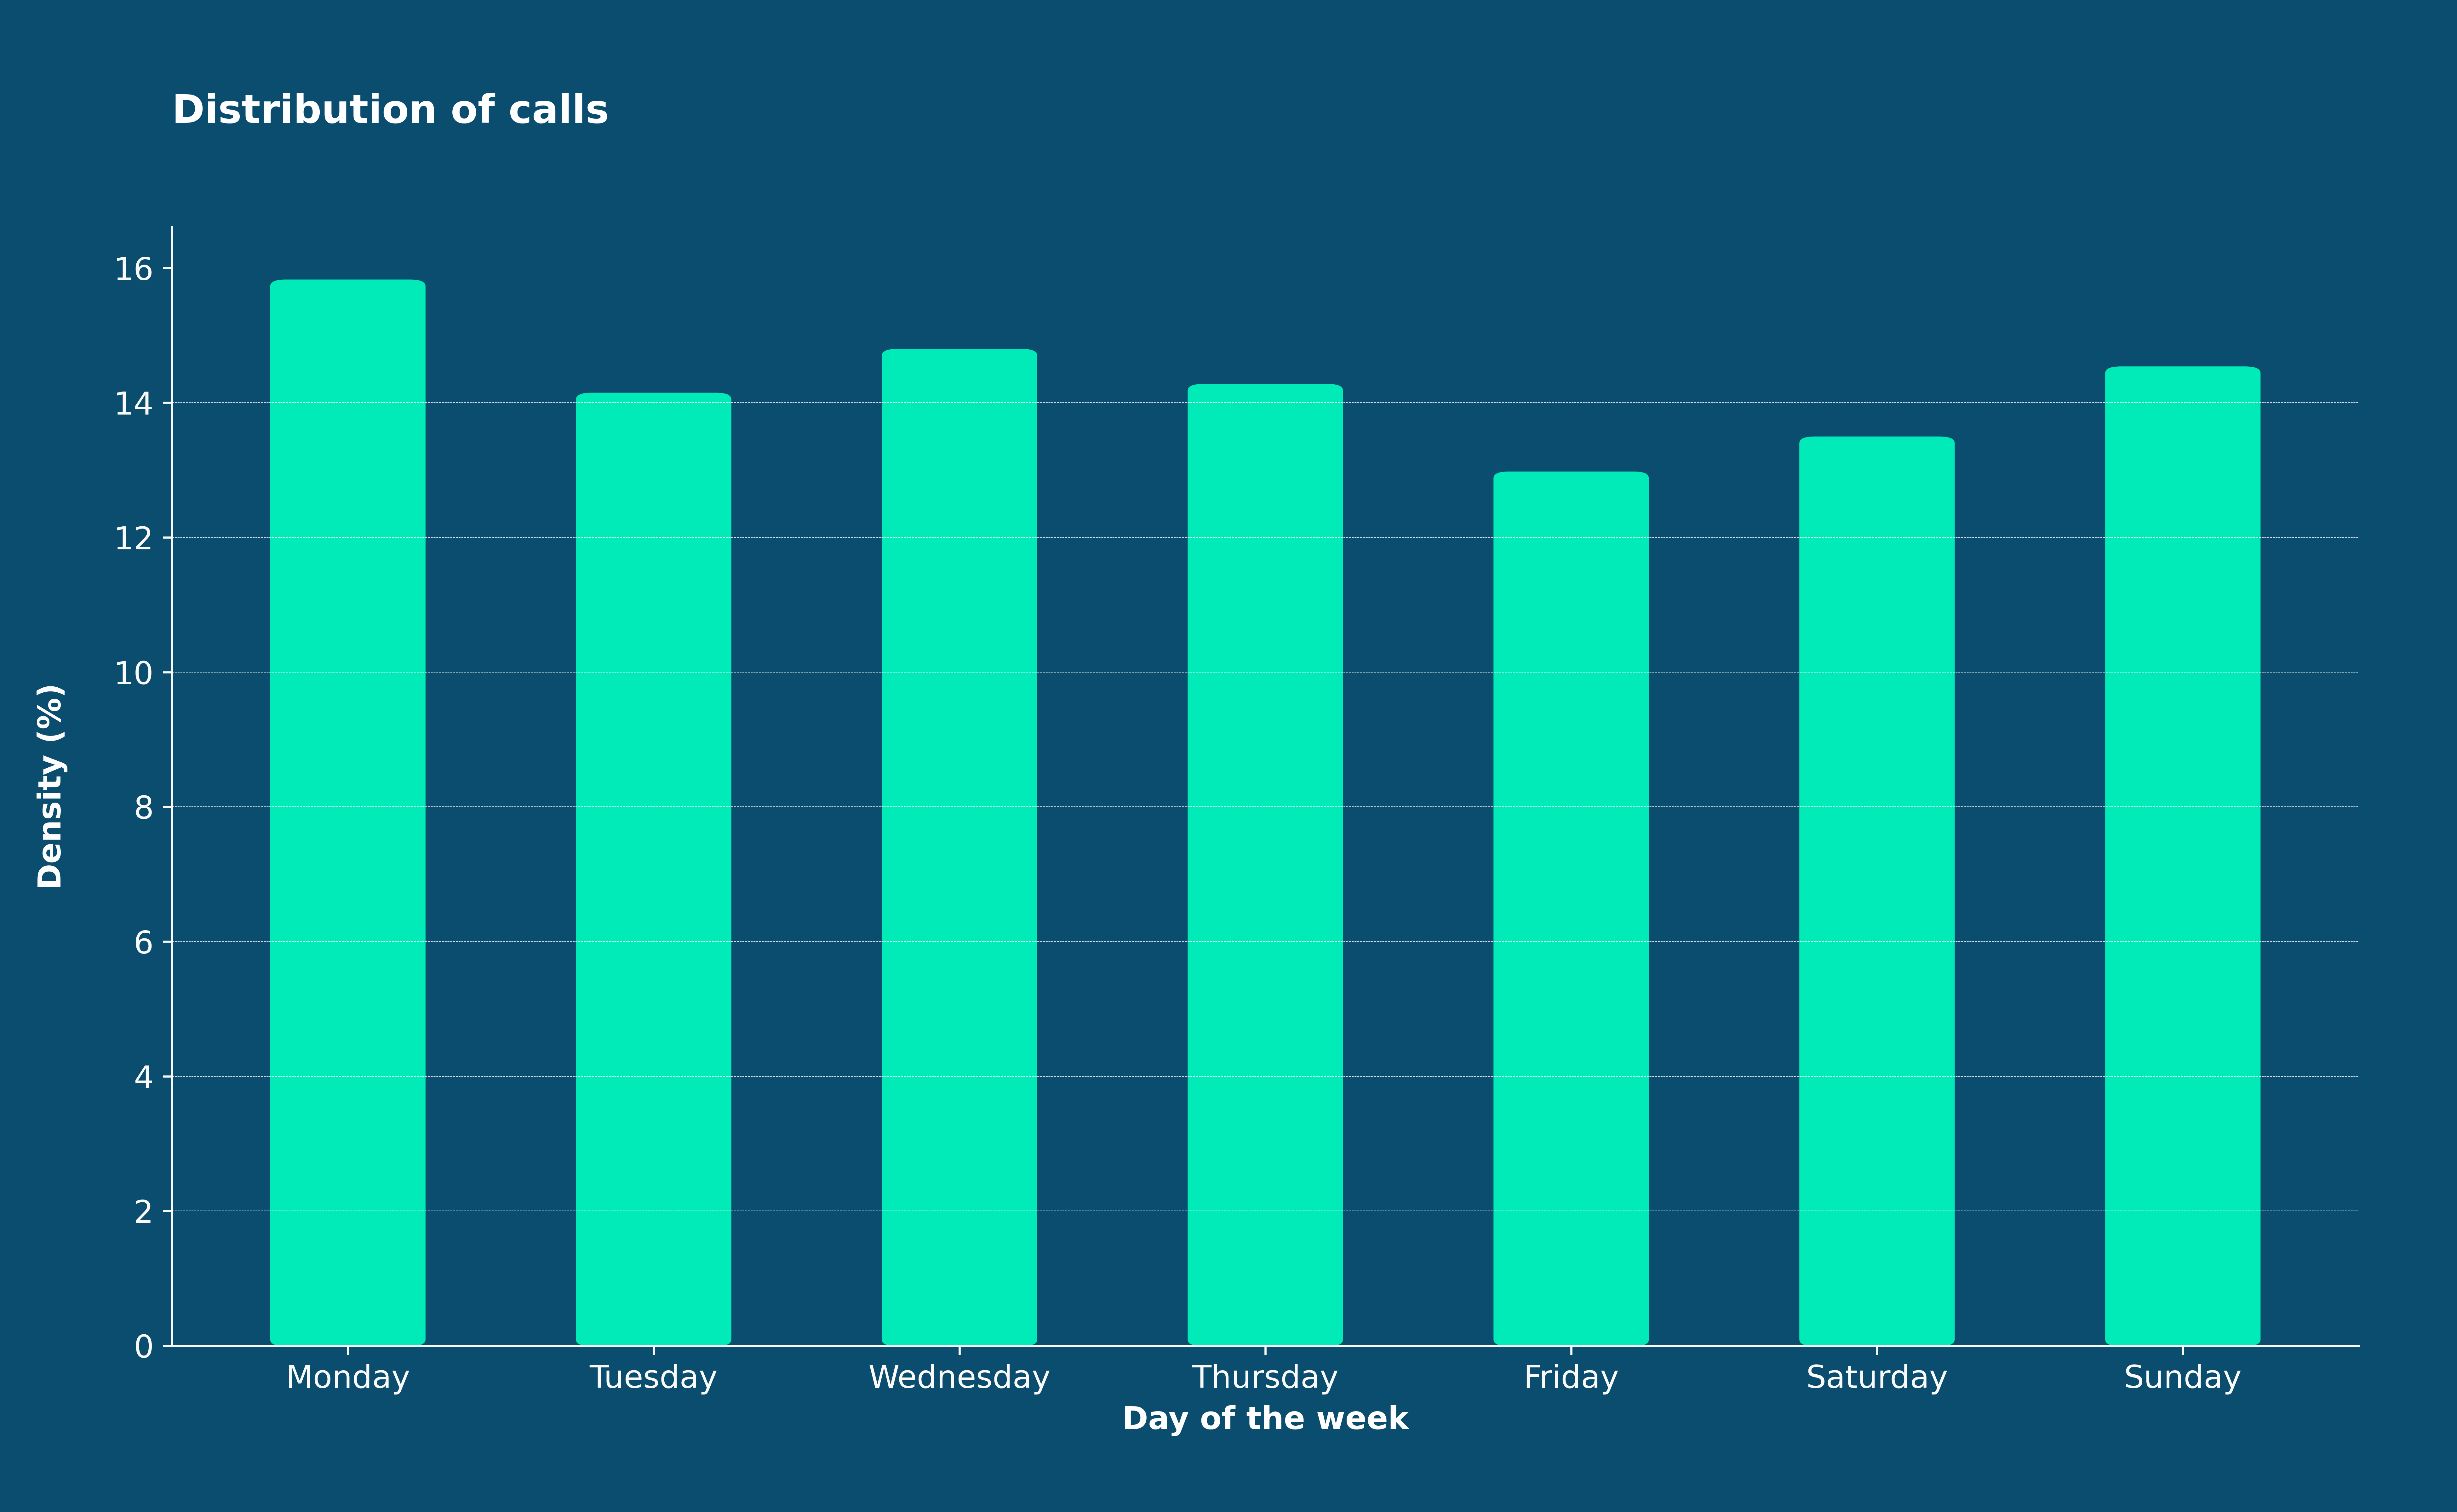
Distraction events (unlocks or phone calls) are time-stamped. Figure 11 shows the daily and hourly distributions of unlocks and call start occurrences for driver A.
 .
. 
 .
. 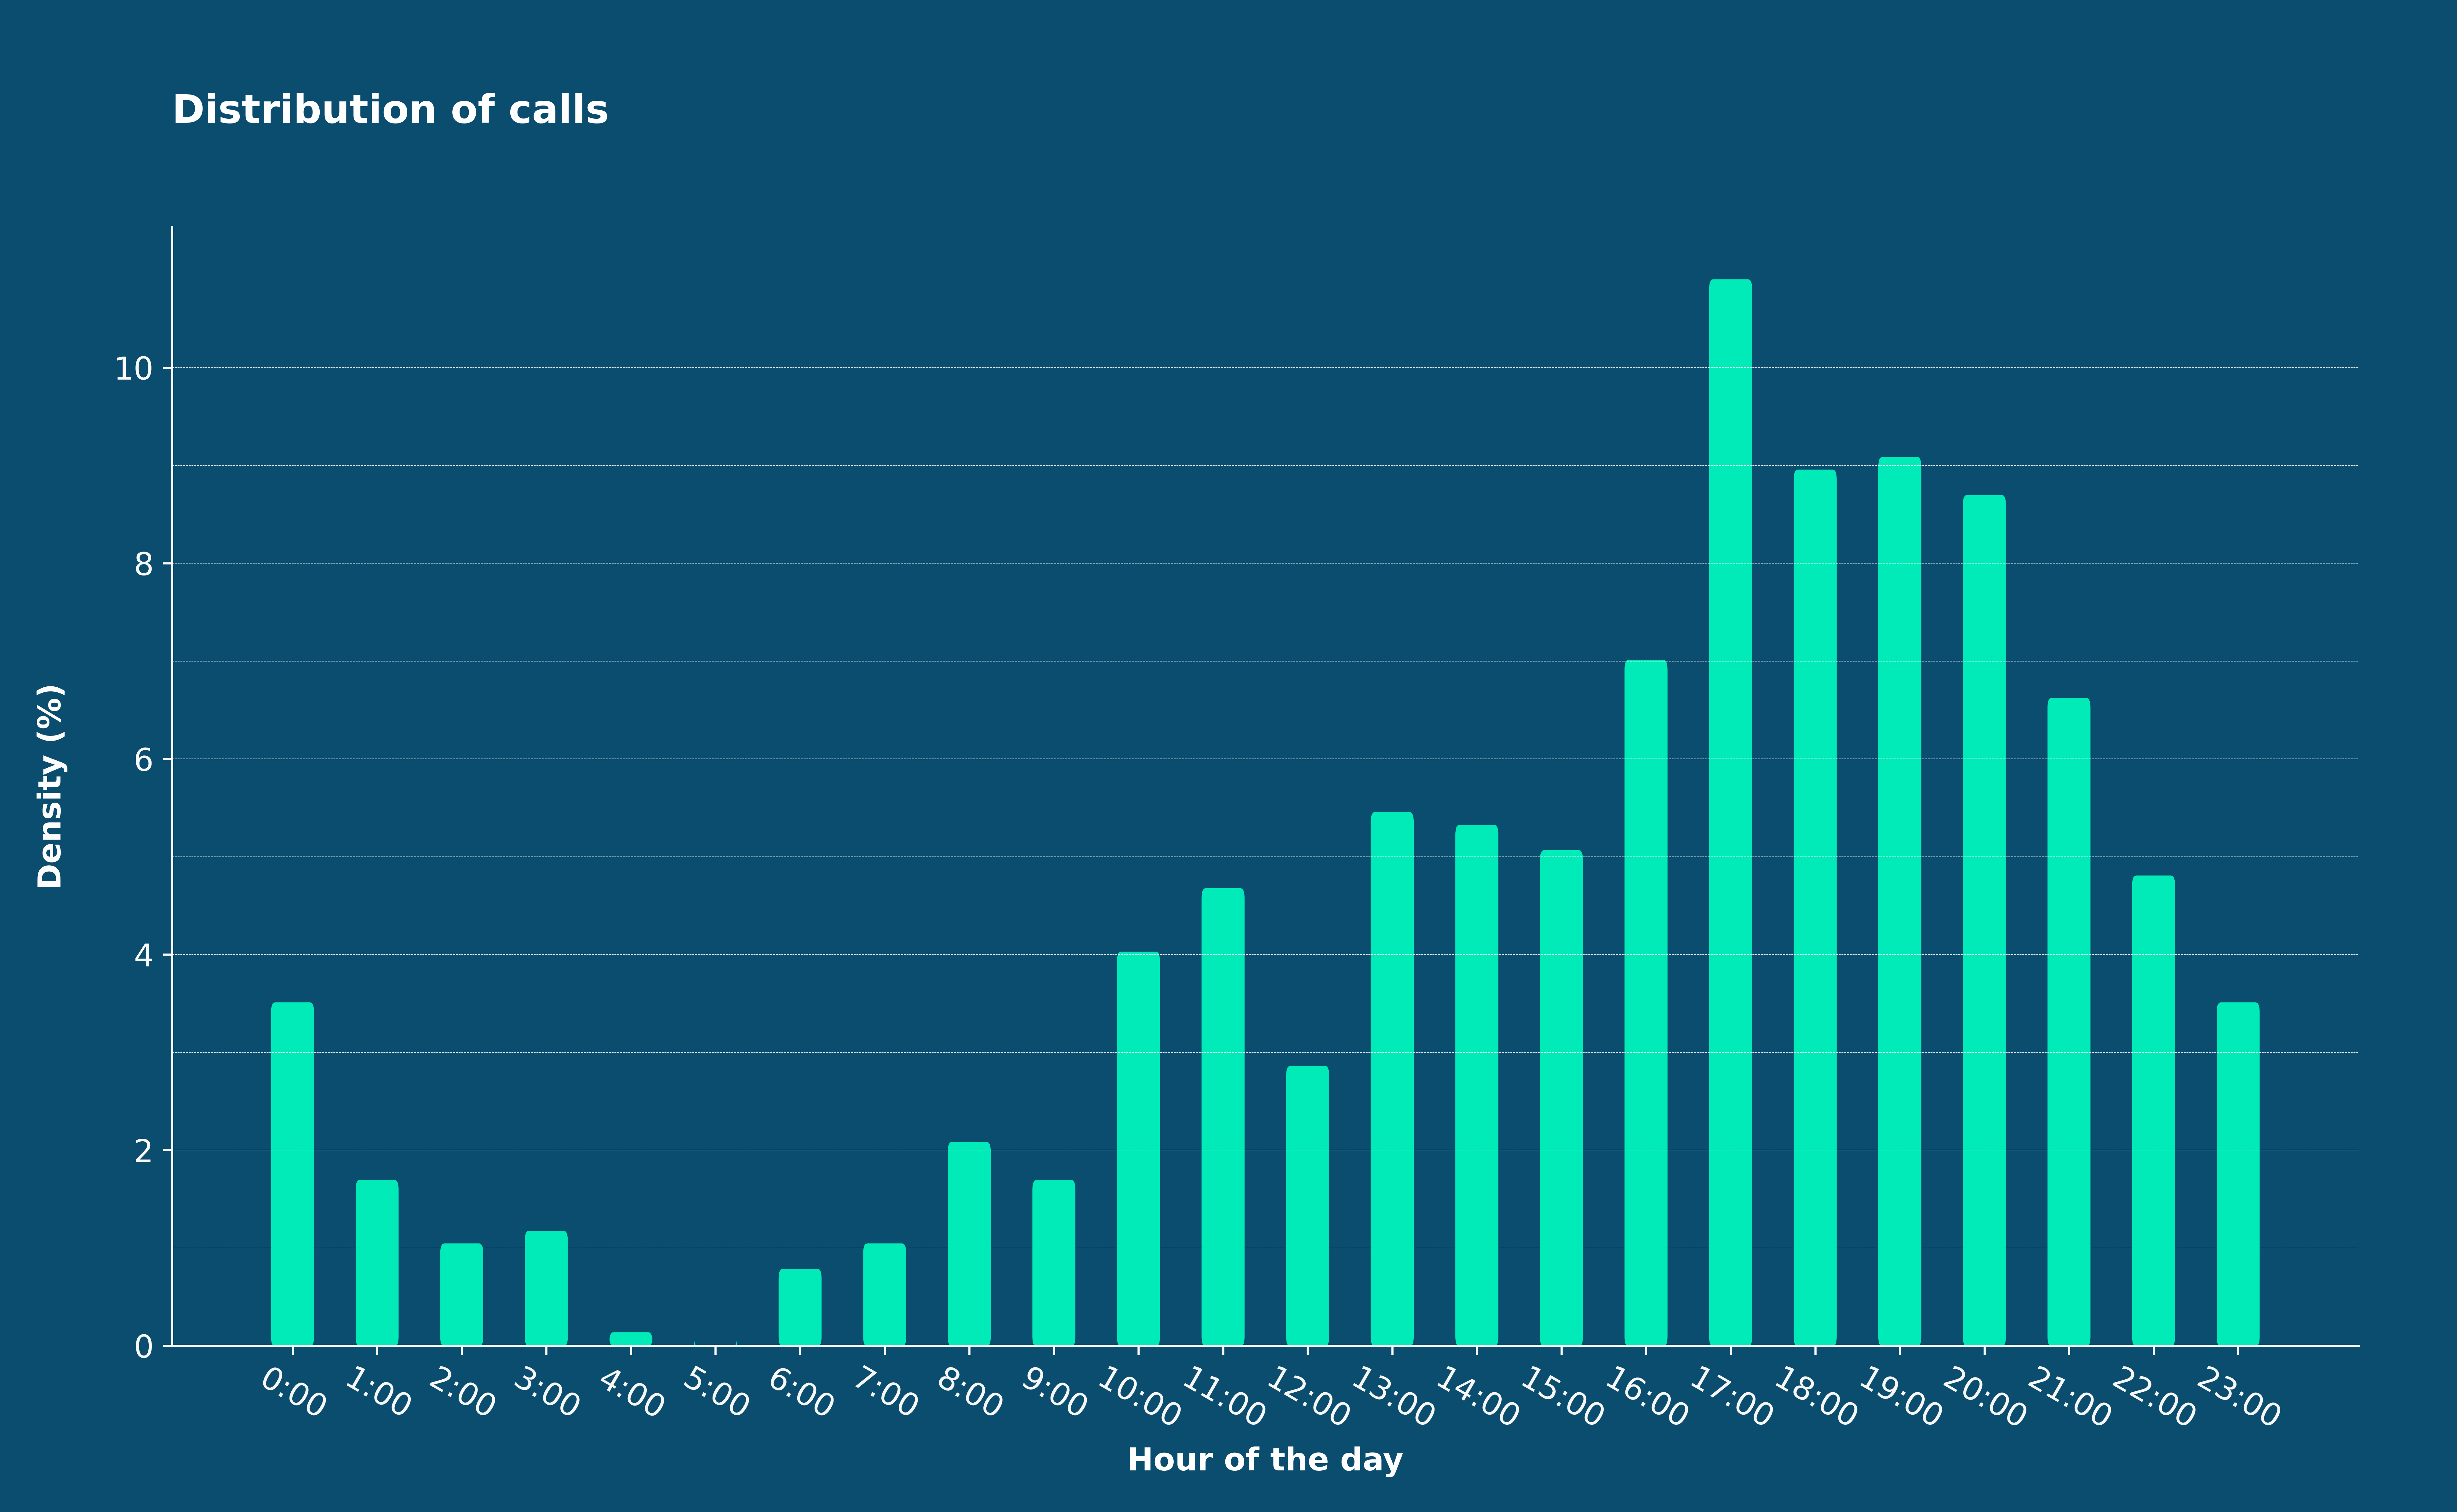
Figure 11 - Distribution of distraction events by time of day and day of the week.
Distraction events for this driver are consistently spread throughout the week. Notably, there is a noticeable surge in call-related events between 5 pm and 8 pm, indicating that the driver is likely engaging in communication activities upon returning home from work.
Conclusion
The search for information, once costly and difficult, has become more simple and more affordable thanks to the smartphone. Just a decade ago, insurers had no way of quantifying the degree of distraction of their policyholders. Today, smartphone telematics not only facilitate the segmentation of driver portfolios to identify the most distracted individuals but also provide personalized distraction profiles for policyholders, including call or unlock data, road context, time of day, and peak usage days.
All these data are accurate and objective. By integrating these insights, insurers can enhance their risk assessment models and build correlations with claims. Most importantly, smartphone telematics empower insurers to pinpoint the highest-risk drivers and take proactive measures to mitigate these risks by focusing preventive efforts on critical indicators.
Several insurers in North America and European countries such as Italy, Germany, and the UK have already launched large-scale programs based on smartphone telematics. You too can gain a deeper understanding of your customers, helping them adopt safer driving practices and reduce their road risk by offering personalized prevention and coaching services.