Introduction
The smartphone telematics solution developed by DriveQuant assesses two components of driver behaviour that influence the risk of a car accident: (1) aggressiveness, which we define as excessive accelerations and brakings, and (2) distraction, which we define as manipulating a cellphone while driving.
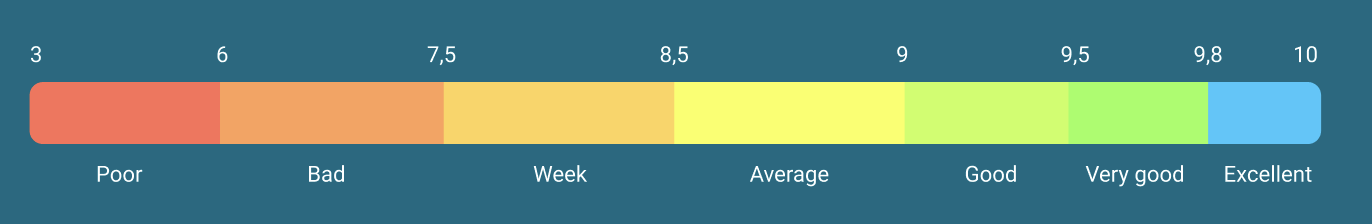
Safety score
The safety score reveals an aggressive or dangerous driving style. It depends on the frequency of harsh accelerations and hard brakings. The more dynamic the driving style, the lower the safety score.
The scale below defines the level of driving of a driver according to his safety score:
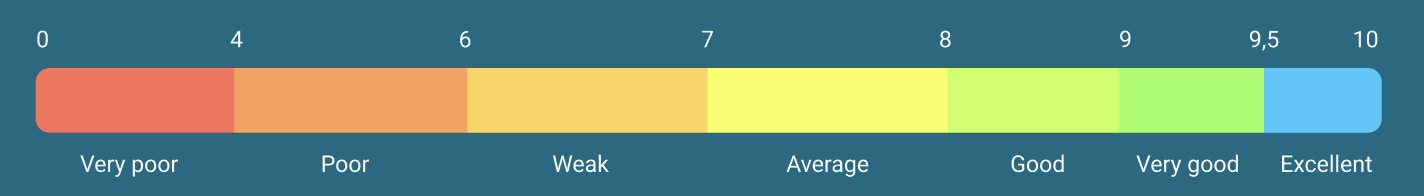
Distraction score
The distraction score represents the lack of attention caused by cell phone use while driving. The more the driver checks his phone (to read messages or to make/answer a call), the lower the distraction score.
The scale below defines a driver's level of attention based on his or her distraction score:
To find out whether there is a relationship between aggressiveness and distraction, we analyse driving data from three Groups composed of several thousand drivers each.
These Groups show different levels of road risk awareness:
-
Group A consists of drivers who have been educated by their insurer about safety and distracted driving through prevention programmes including driving challenges. Local legislation on phone distraction is restrictive and strongly enforced.
-
Group B consists of drivers who have been exposed solely to zero distraction campaigns led by their insurer. Local distraction laws are restrictive and strongly enforced.
-
Group C consists of drivers who have not yet been subject to prevention campaigns. In addition, local legislation is less strict than for the other two Groups.
To ensure that the analysis results are meaningful, each group includes drivers for whom a minimum of 100 trips were analysed.
The figures below show the distraction score as a function of the safety score. Each point represents a subset of drivers with an identical average score. The radius of the dot represents the number of drivers in each subset.
Group A
.png?width=900&height=600&name=newplot%20(25).png)
The figure above shows that very good drivers, with a safety score above 9.5, have a distraction score above 8.5. This corresponds to one unlocking every 75 km.
In contrast, the weakest drivers, with a safety score below 7.5, mostly have a distraction score also below 7.5 or 7. This indicates that they unlock their phone every 30 km, twice as much as the very good drivers in the group.
With a Pearson coefficient of 0.9, the figure shows a nearly linear correlation between the distraction score and the safety score for this group of drivers.
This relationship means that the most careful drivers on the road pay as much attention to their accelerations and brakings as they do to their phone use. In contrast, the least careful drivers combine both risk factors: their driving style is too dynamic and they regularly use their phone while driving.
Is there a similar trend among drivers in the other two Groups?
To see if the above conclusion can be generalised, data from all three Groups of drivers are displayed in the same frame of reference.
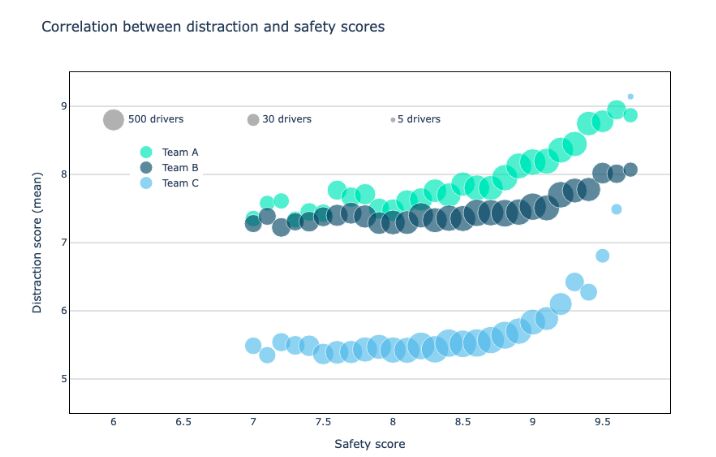
This figure shows that the correlation between the safety score and the distraction score also exists for drivers in Groups B and C. However, the average level of distraction is higher for drivers in Groups B and C, even for very good drivers.
For example, the very good drivers in Group B unlock their phones every 50 km and those in Group C unlock their phones every 30 km. This is twice as often as the best drivers in Group A.
The level of distraction among the rest of the drivers in Groups B and C is homogeneous, which again distinguishes them from their Group A counterparts. All drivers in Groups B and C with a safety score between 6 and 9, i.e. drivers considered to be poor, low, or average in safety, have a distraction score close to 7.5 (Group B) or close to 5.5 (Group C). A distraction score under 7 indicates that a 20-second driving call was made or received. This indicates that the majority of Group C drivers make phone calls while driving, even those with the calmest driving style (i.e. with a safety score above 9).
Do not miss our podcast...
Philippe Moulin, DriveQuant CEO, was invited as an expert on the SCOR INNOVATION PODCAST to discuss distracted driving and smartphone telematics. Philippe deciphers all the opportunities derived from telematics data. Click here to listen to the SCOR INNOVATION PODCAST dedicated to road safety and learn how to fight off distracted driving using smartphone telematics. |

Conclusion
Although the two phenomena are not related, there is a clear correlation between the safety score and the distraction score: the less aggressive drivers are less distracted overall.
We also observe that the levels of distraction are very different among the three Groups. These differences coincide with the level of road risk awareness generated through prevention campaigns conducted by insurers.
For example, Group A drivers who have been exposed to prevention campaigns on safety and distraction by their insurers score better on both indicators. The correlation between the two scores is also strongest among drivers in this group. Therefore, driving challenges focusing alternately on safety and distraction impact significantly the driving behaviour of motorists.
The influence of the challenges on driving behaviour can also be observed among the drivers in group B. Exposed to prevention programs focused solely on distraction, they show a level of distraction close to that of Group A drivers and much higher than the level of distraction of Group C drivers who have not been exposed to any prevention campaign on aggressive driving or distracted driving.
Therefore, insurers have a real role to play in improving the driving behaviour of their policyholders, given that customers who have been exposed to prevention programmes drive better and are less distracted. It is thus in the interest of insurers to launch driving challenges to incentivize drivers to adopt safest driving practices and measure the direct and induced results.