Introduction
Following on from our research that found a correlation between the safety score and the distraction score, we continue our exploration of the different facets of driving behavior by investigating the relationship between safe driving behavior and eco-driving.
Safety score
The safety score indicates whether the driver is cautious or has an overly dynamic driving style based on the frequency of hard acceleration and harsh braking. The smoother and more fluid the driver's driving style, the higher the safety score.
The scale below indicates the driving skill a driver achieved according to his or her safety score:

Eco-driving score
The eco-driving score measures driving efficiency in terms of vehicle's energy consumption. It increases if the driver applies the principles of eco-driving: a strong acceleration to reach cruising speed quickly, a steady pace, and anticipation to minimize unnecessary braking that wastes stored kinetic energy.
The scale below determines the level of energy optimization achieved by a driver according to his eco-driving score:

To determine whether there is a relationship between safe driving behavior and eco-driving, we analyze the driving data of three groups of several thousand drivers each.
To ensure that the analysis results are representative, each group includes drivers for whom a minimum of 100 trips have been analyzed.
Given the importance of the road context in eco-driving practice, the data is split into 3 categories that are analyzed independently for:
- urban environments
- extra-urban conditions,
- and expressways
The figures below show the eco-driving score as a function of the safety score. Each point corresponds to a subset of drivers with an identical average safety score. The radius of the point represents the number of drivers in each subset.
Urban areas
In urban areas, the correlation between the safety score and eco-driving score is weak with a Pearson coefficient of 0.31. It indicates that excellent drivers with a safety score above 9.5 are also the best eco-drivers since they obtain an eco-driving score above 7.5.
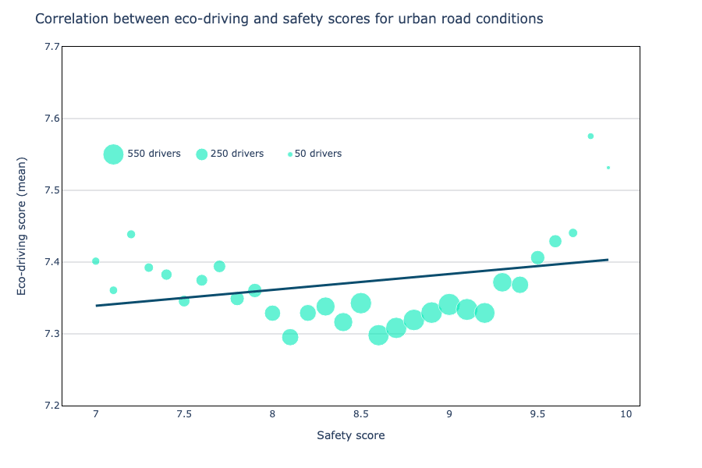
Urban driving does not make it easy to practice eco-driving: multiple stops, repeated slowing down, or difficulty maintaining a constant speed even at lower speeds. This is why most drivers have an eco-driving score between 7.3 and 7.4, which is an "average" score according to our level scale introduced earlier.
Does this mean that there is no room for eco-driving in urban areas? Given that some drivers perform better, there is room for improvement, at least to increase from an "average" score to a "good" score. There are no small savings in pollutant emissions, every gram of CO2 saved matters.
Extra-urban environments
There is an almost linear correlation between the safety score and the eco-driving score in the extra-urban context with a Pearson coefficient of 0.81.
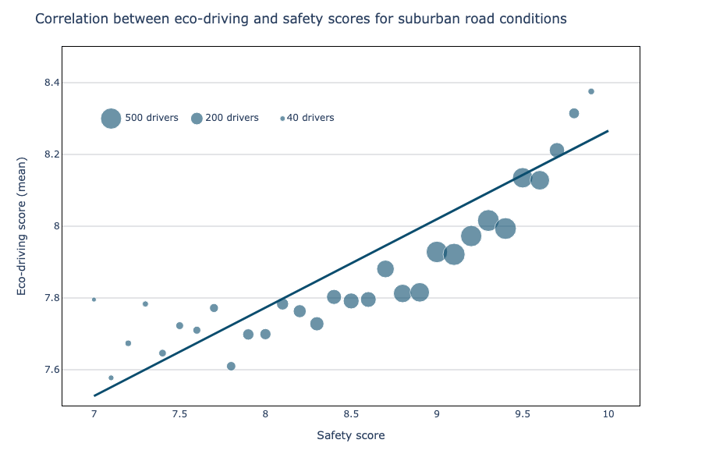
That indicates that practicing eco-driving is beneficial for road safety. Likewise, driving safely leads to better eco-driving performance. Thus, all drivers with a safety score above 8.5 have an eco-driving score above 7.8, which places them at the "good" level.
Compared to urban areas, the results here show that driving in an extra-urban environment results in a better eco-driving performance. This is why higher levels of this score are achieved.
Expressways
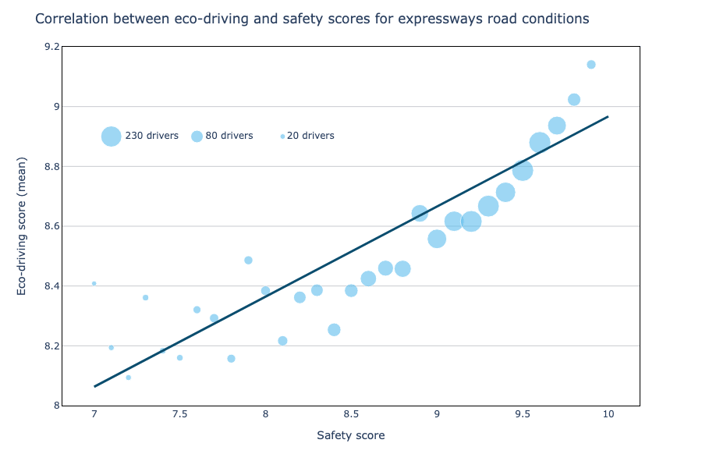
The correlation between the safety score and the eco-driving score on expressways is even stronger than in extra-urban environments, as the Pearson coefficient is close to 0.9. This result is not surprising given that expressways are the most favorable environment for eco-driving and the adoption of safe driving behavior:
-
Maintaining a steady pace is easy,
-
Sudden braking and acceleration are less frequent if the driver anticipates.
Therefore, most drivers on fast lanes have an eco-driving score that ranks them as "good" or "very good" and they are also careful.
Conclusion
The analysis of the relationship between the eco-driving and safety scores for the three road contexts shows a link between the adoption of safe driving behavior and the practice of eco-driving. Indeed, the least risky drivers (with a high safety score) are also those who adopt the most sustainable driving (with a high eco-driving score).
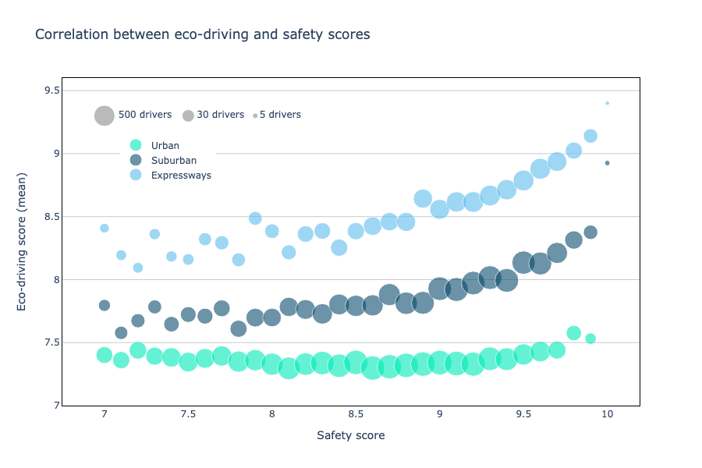
The correlation changes according to the road environment. It is stronger in environments where the driver encounters the least constraints: in extra-urban areas or on expressways. In urban areas, the correlation is weak given that it is more difficult to increase the eco-driving score than the safety score.
Beyond the benefits we present in our white paper on the opportunities of eco-driving, insurers have a vested interest in encouraging the development of eco-driving among their customers because the drivers who adopt a sustainable driving style also have a lower risk profile than other drivers. This is a way of bringing together two key issues for insurers: improving road safety and reducing the environmental footprint of their policyholders.